Sudanese vs Immigrants from Italy Unemployment Among Women with Children Ages 6 to 17 years
COMPARE
Sudanese
Immigrants from Italy
Unemployment Among Women with Children Ages 6 to 17 years
Unemployment Among Women with Children Ages 6 to 17 years Comparison
Sudanese
Immigrants from Italy
7.4%
UNEMPLOYMENT AMONG WOMEN WITH CHILDREN AGES 6 TO 17 YEARS
100.0/ 100
METRIC RATING
14th/ 347
METRIC RANK
9.0%
UNEMPLOYMENT AMONG WOMEN WITH CHILDREN AGES 6 TO 17 YEARS
43.7/ 100
METRIC RATING
176th/ 347
METRIC RANK
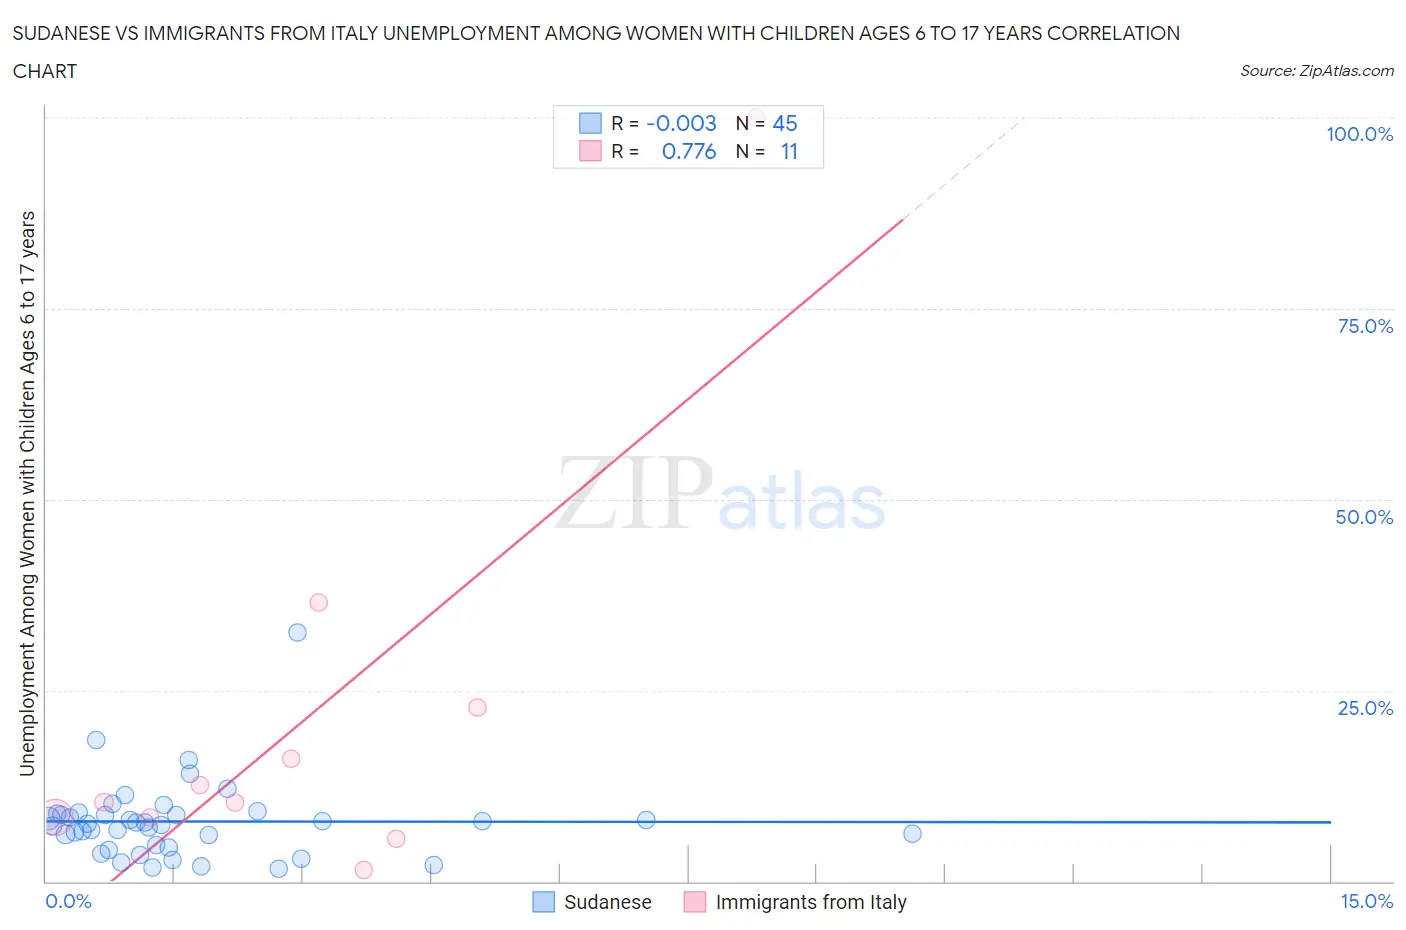
Sudanese vs Immigrants from Italy Unemployment Among Women with Children Ages 6 to 17 years Correlation Chart
The statistical analysis conducted on geographies consisting of 98,187,215 people shows no correlation between the proportion of Sudanese and unemployment rate among women with children between the ages 6 and 17 in the United States with a correlation coefficient (R) of -0.003 and weighted average of 7.4%. Similarly, the statistical analysis conducted on geographies consisting of 237,959,697 people shows a strong positive correlation between the proportion of Immigrants from Italy and unemployment rate among women with children between the ages 6 and 17 in the United States with a correlation coefficient (R) of 0.776 and weighted average of 9.0%, a difference of 21.3%.
Unemployment Among Women with Children Ages 6 to 17 years Correlation Summary
| Measurement | Sudanese | Immigrants from Italy |
| Minimum | 1.6% | 1.4% |
| Maximum | 32.5% | 100.0% |
| Range | 30.9% | 98.6% |
| Mean | 7.8% | 21.1% |
| Median | 7.5% | 10.4% |
| Interquartile 25% (IQ1) | 4.6% | 8.4% |
| Interquartile 75% (IQ3) | 8.8% | 22.7% |
| Interquartile Range (IQR) | 4.2% | 14.3% |
| Standard Deviation (Sample) | 5.2% | 27.8% |
| Standard Deviation (Population) | 5.1% | 26.5% |
Similar Demographics by Unemployment Among Women with Children Ages 6 to 17 years
Demographics Similar to Sudanese by Unemployment Among Women with Children Ages 6 to 17 years
In terms of unemployment among women with children ages 6 to 17 years, the demographic groups most similar to Sudanese are Indonesian (7.4%, a difference of 0.040%), Bangladeshi (7.4%, a difference of 0.75%), Puget Sound Salish (7.5%, a difference of 1.1%), Immigrants from Taiwan (7.3%, a difference of 1.1%), and Immigrants from Burma/Myanmar (7.5%, a difference of 1.4%).
| Demographics | Rating | Rank | Unemployment Among Women with Children Ages 6 to 17 years |
| Soviet Union | 100.0 /100 | #7 | Exceptional 7.1% |
| Immigrants | Hong Kong | 100.0 /100 | #8 | Exceptional 7.2% |
| Assyrians/Chaldeans/Syriacs | 100.0 /100 | #9 | Exceptional 7.2% |
| Immigrants | Fiji | 100.0 /100 | #10 | Exceptional 7.3% |
| Immigrants | Taiwan | 100.0 /100 | #11 | Exceptional 7.3% |
| Bangladeshis | 100.0 /100 | #12 | Exceptional 7.4% |
| Indonesians | 100.0 /100 | #13 | Exceptional 7.4% |
| Sudanese | 100.0 /100 | #14 | Exceptional 7.4% |
| Puget Sound Salish | 100.0 /100 | #15 | Exceptional 7.5% |
| Immigrants | Burma/Myanmar | 100.0 /100 | #16 | Exceptional 7.5% |
| Cambodians | 100.0 /100 | #17 | Exceptional 7.5% |
| Afghans | 100.0 /100 | #18 | Exceptional 7.6% |
| Filipinos | 100.0 /100 | #19 | Exceptional 7.6% |
| Immigrants | Singapore | 100.0 /100 | #20 | Exceptional 7.7% |
| Immigrants | India | 100.0 /100 | #21 | Exceptional 7.7% |
Demographics Similar to Immigrants from Italy by Unemployment Among Women with Children Ages 6 to 17 years
In terms of unemployment among women with children ages 6 to 17 years, the demographic groups most similar to Immigrants from Italy are Immigrants from Sierra Leone (9.0%, a difference of 0.10%), Immigrants from Jordan (9.0%, a difference of 0.10%), Menominee (9.0%, a difference of 0.20%), Immigrants from Zaire (9.0%, a difference of 0.25%), and Immigrants from Costa Rica (9.0%, a difference of 0.28%).
| Demographics | Rating | Rank | Unemployment Among Women with Children Ages 6 to 17 years |
| British | 55.2 /100 | #169 | Average 8.9% |
| Turks | 54.1 /100 | #170 | Average 8.9% |
| Jordanians | 52.2 /100 | #171 | Average 9.0% |
| Immigrants | West Indies | 52.2 /100 | #172 | Average 9.0% |
| Immigrants | Brazil | 51.0 /100 | #173 | Average 9.0% |
| Immigrants | Costa Rica | 50.0 /100 | #174 | Average 9.0% |
| Immigrants | Sierra Leone | 45.9 /100 | #175 | Average 9.0% |
| Immigrants | Italy | 43.7 /100 | #176 | Average 9.0% |
| Immigrants | Jordan | 41.6 /100 | #177 | Average 9.0% |
| Menominee | 39.3 /100 | #178 | Fair 9.0% |
| Immigrants | Zaire | 38.3 /100 | #179 | Fair 9.0% |
| Ethiopians | 37.6 /100 | #180 | Fair 9.0% |
| Immigrants | Czechoslovakia | 34.5 /100 | #181 | Fair 9.0% |
| South American Indians | 34.4 /100 | #182 | Fair 9.0% |
| Swiss | 33.5 /100 | #183 | Fair 9.0% |