Yakama vs Immigrants from Italy High School Diploma
COMPARE
Yakama
Immigrants from Italy
High School Diploma
High School Diploma Comparison
Yakama
Immigrants from Italy
80.0%
HIGH SCHOOL DIPLOMA
0.0/ 100
METRIC RATING
345th/ 347
METRIC RANK
89.8%
HIGH SCHOOL DIPLOMA
87.4/ 100
METRIC RATING
131st/ 347
METRIC RANK
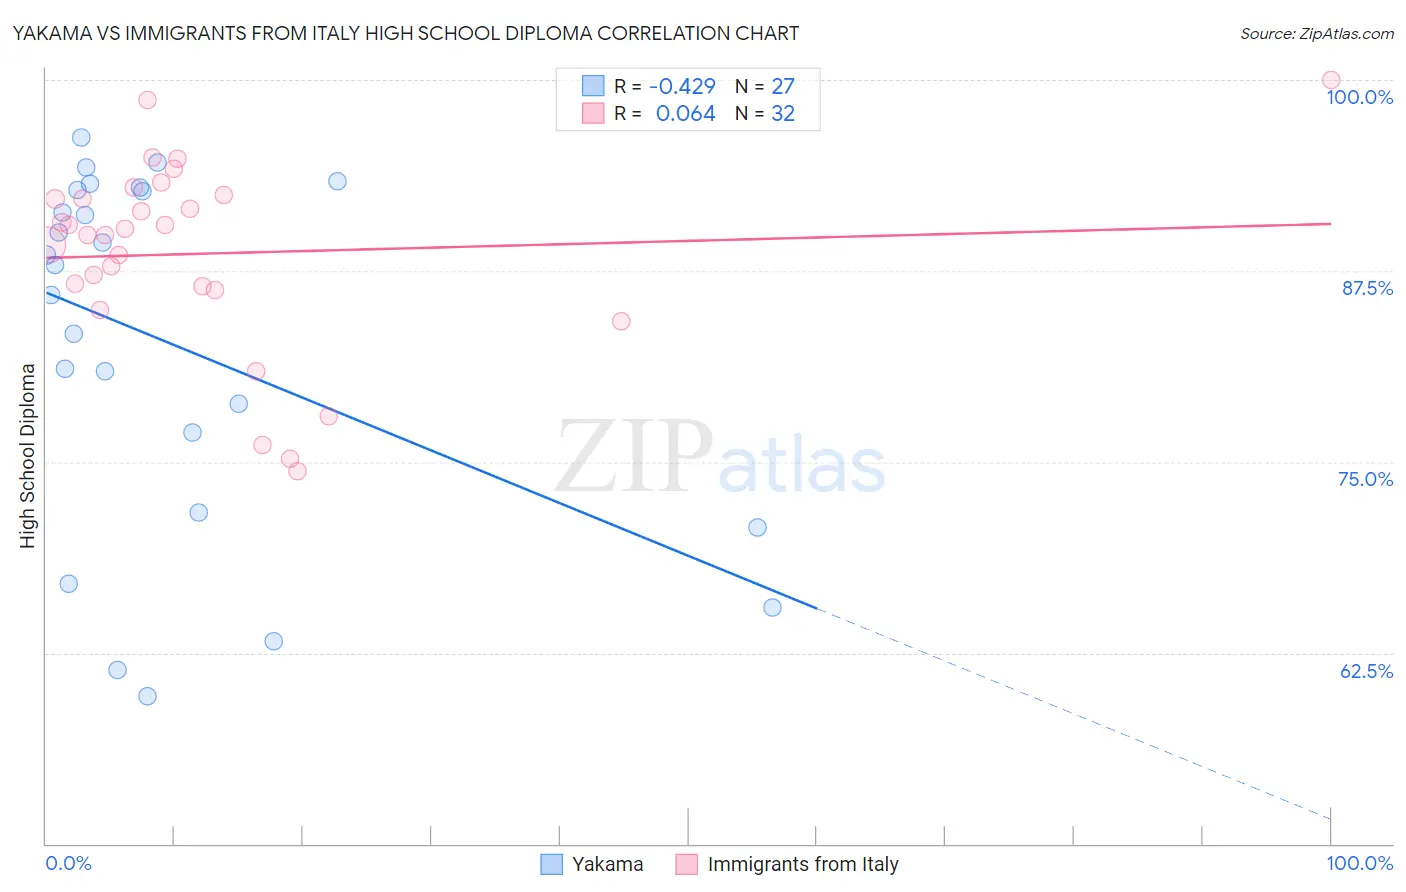
Yakama vs Immigrants from Italy High School Diploma Correlation Chart
The statistical analysis conducted on geographies consisting of 19,923,144 people shows a moderate negative correlation between the proportion of Yakama and percentage of population with at least high school diploma education in the United States with a correlation coefficient (R) of -0.429 and weighted average of 80.0%. Similarly, the statistical analysis conducted on geographies consisting of 324,226,009 people shows a slight positive correlation between the proportion of Immigrants from Italy and percentage of population with at least high school diploma education in the United States with a correlation coefficient (R) of 0.064 and weighted average of 89.8%, a difference of 12.2%.
High School Diploma Correlation Summary
| Measurement | Yakama | Immigrants from Italy |
| Minimum | 59.7% | 74.4% |
| Maximum | 96.3% | 100.0% |
| Range | 36.6% | 25.6% |
| Mean | 82.8% | 88.6% |
| Median | 87.9% | 90.0% |
| Interquartile 25% (IQ1) | 71.7% | 86.4% |
| Interquartile 75% (IQ3) | 92.8% | 92.3% |
| Interquartile Range (IQR) | 21.1% | 6.0% |
| Standard Deviation (Sample) | 11.7% | 6.3% |
| Standard Deviation (Population) | 11.4% | 6.2% |
Similar Demographics by High School Diploma
Demographics Similar to Yakama by High School Diploma
In terms of high school diploma, the demographic groups most similar to Yakama are Immigrants from Central America (80.1%, a difference of 0.16%), Spanish American Indian (79.8%, a difference of 0.29%), Immigrants from Mexico (79.5%, a difference of 0.56%), Immigrants from El Salvador (80.8%, a difference of 1.0%), and Immigrants from Guatemala (81.4%, a difference of 1.7%).
| Demographics | Rating | Rank | High School Diploma |
| Immigrants | Latin America | 0.0 /100 | #333 | Tragic 82.1% |
| Tohono O'odham | 0.0 /100 | #334 | Tragic 82.1% |
| Guatemalans | 0.0 /100 | #335 | Tragic 82.0% |
| Immigrants | Dominican Republic | 0.0 /100 | #336 | Tragic 82.0% |
| Immigrants | Yemen | 0.0 /100 | #337 | Tragic 81.8% |
| Salvadorans | 0.0 /100 | #338 | Tragic 81.7% |
| Pima | 0.0 /100 | #339 | Tragic 81.6% |
| Houma | 0.0 /100 | #340 | Tragic 81.5% |
| Mexicans | 0.0 /100 | #341 | Tragic 81.4% |
| Immigrants | Guatemala | 0.0 /100 | #342 | Tragic 81.4% |
| Immigrants | El Salvador | 0.0 /100 | #343 | Tragic 80.8% |
| Immigrants | Central America | 0.0 /100 | #344 | Tragic 80.1% |
| Yakama | 0.0 /100 | #345 | Tragic 80.0% |
| Spanish American Indians | 0.0 /100 | #346 | Tragic 79.8% |
| Immigrants | Mexico | 0.0 /100 | #347 | Tragic 79.5% |
Demographics Similar to Immigrants from Italy by High School Diploma
In terms of high school diploma, the demographic groups most similar to Immigrants from Italy are Immigrants from Bosnia and Herzegovina (89.8%, a difference of 0.0%), Albanian (89.8%, a difference of 0.010%), Immigrants from Jordan (89.8%, a difference of 0.010%), Immigrants from Ukraine (89.8%, a difference of 0.020%), and Basque (89.8%, a difference of 0.040%).
| Demographics | Rating | Rank | High School Diploma |
| Mongolians | 91.6 /100 | #124 | Exceptional 89.9% |
| Egyptians | 91.1 /100 | #125 | Exceptional 89.9% |
| Alaska Natives | 91.0 /100 | #126 | Exceptional 89.9% |
| Immigrants | Eastern Asia | 89.2 /100 | #127 | Excellent 89.9% |
| Puget Sound Salish | 89.1 /100 | #128 | Excellent 89.9% |
| Basques | 88.5 /100 | #129 | Excellent 89.8% |
| Immigrants | Ukraine | 87.9 /100 | #130 | Excellent 89.8% |
| Immigrants | Italy | 87.4 /100 | #131 | Excellent 89.8% |
| Immigrants | Bosnia and Herzegovina | 87.3 /100 | #132 | Excellent 89.8% |
| Albanians | 87.2 /100 | #133 | Excellent 89.8% |
| Immigrants | Jordan | 87.2 /100 | #134 | Excellent 89.8% |
| Chippewa | 85.6 /100 | #135 | Excellent 89.7% |
| Ugandans | 83.7 /100 | #136 | Excellent 89.7% |
| Arabs | 83.6 /100 | #137 | Excellent 89.7% |
| Assyrians/Chaldeans/Syriacs | 82.5 /100 | #138 | Excellent 89.7% |