West Indian vs Immigrants from Italy Unemployment Among Women with Children Ages 6 to 17 years
COMPARE
West Indian
Immigrants from Italy
Unemployment Among Women with Children Ages 6 to 17 years
Unemployment Among Women with Children Ages 6 to 17 years Comparison
West Indians
Immigrants from Italy
9.5%
UNEMPLOYMENT AMONG WOMEN WITH CHILDREN AGES 6 TO 17 YEARS
0.4/ 100
METRIC RATING
265th/ 347
METRIC RANK
9.0%
UNEMPLOYMENT AMONG WOMEN WITH CHILDREN AGES 6 TO 17 YEARS
43.7/ 100
METRIC RATING
176th/ 347
METRIC RANK
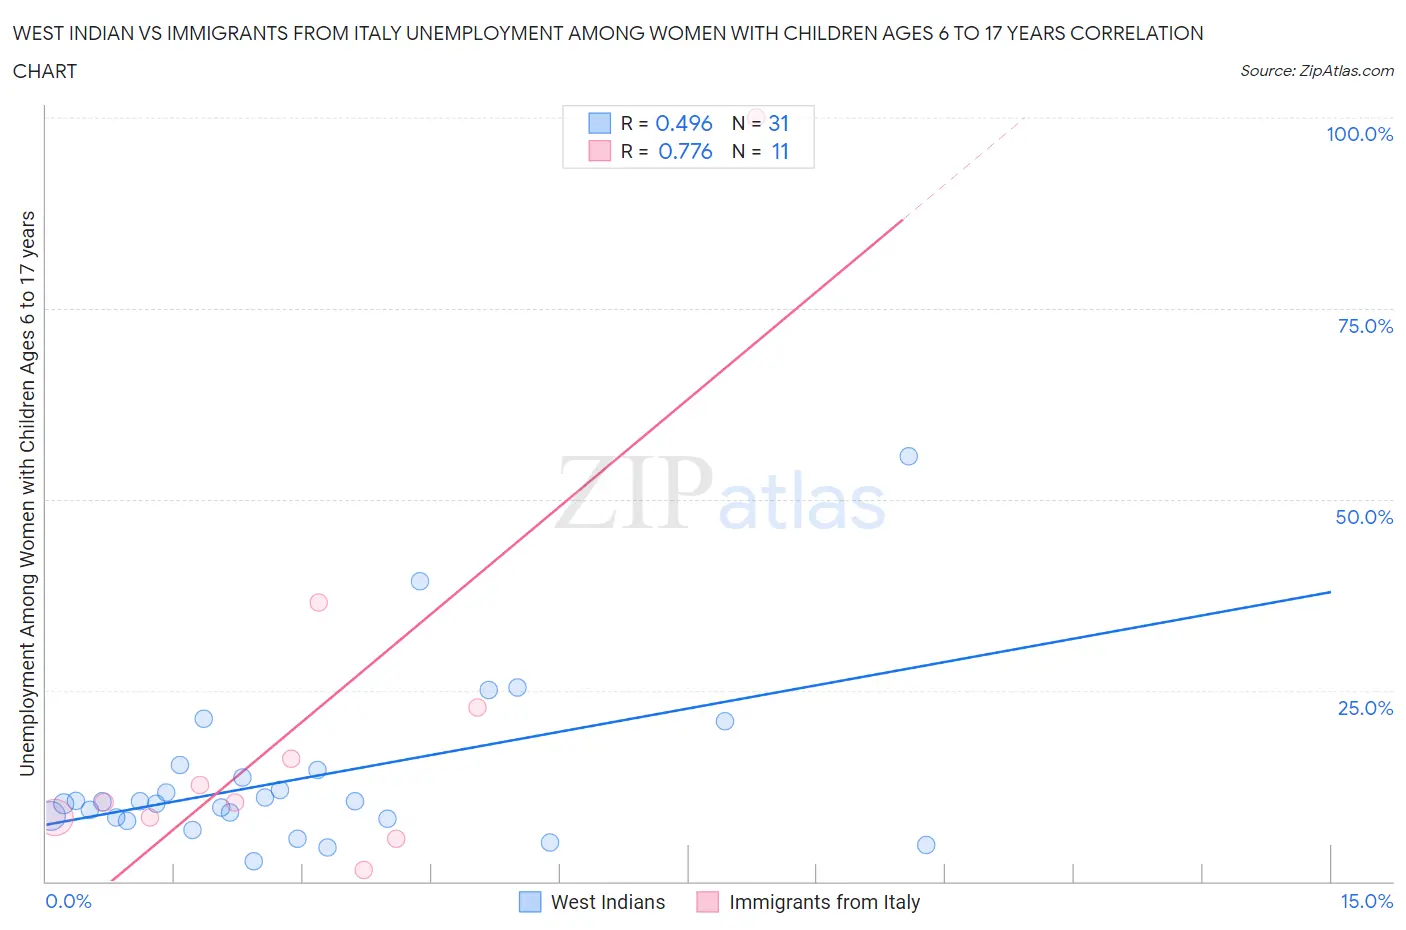
West Indian vs Immigrants from Italy Unemployment Among Women with Children Ages 6 to 17 years Correlation Chart
The statistical analysis conducted on geographies consisting of 202,380,945 people shows a moderate positive correlation between the proportion of West Indians and unemployment rate among women with children between the ages 6 and 17 in the United States with a correlation coefficient (R) of 0.496 and weighted average of 9.5%. Similarly, the statistical analysis conducted on geographies consisting of 237,959,697 people shows a strong positive correlation between the proportion of Immigrants from Italy and unemployment rate among women with children between the ages 6 and 17 in the United States with a correlation coefficient (R) of 0.776 and weighted average of 9.0%, a difference of 5.9%.
Unemployment Among Women with Children Ages 6 to 17 years Correlation Summary
| Measurement | West Indian | Immigrants from Italy |
| Minimum | 2.7% | 1.4% |
| Maximum | 55.7% | 100.0% |
| Range | 53.0% | 98.6% |
| Mean | 13.5% | 21.1% |
| Median | 10.4% | 10.4% |
| Interquartile 25% (IQ1) | 8.2% | 8.4% |
| Interquartile 75% (IQ3) | 14.6% | 22.7% |
| Interquartile Range (IQR) | 6.4% | 14.3% |
| Standard Deviation (Sample) | 10.8% | 27.8% |
| Standard Deviation (Population) | 10.7% | 26.5% |
Similar Demographics by Unemployment Among Women with Children Ages 6 to 17 years
Demographics Similar to West Indians by Unemployment Among Women with Children Ages 6 to 17 years
In terms of unemployment among women with children ages 6 to 17 years, the demographic groups most similar to West Indians are Immigrants from Ghana (9.5%, a difference of 0.030%), Immigrants from Jamaica (9.5%, a difference of 0.16%), Irish (9.5%, a difference of 0.18%), Lebanese (9.5%, a difference of 0.27%), and Senegalese (9.5%, a difference of 0.31%).
| Demographics | Rating | Rank | Unemployment Among Women with Children Ages 6 to 17 years |
| Immigrants | Mexico | 0.7 /100 | #258 | Tragic 9.5% |
| Immigrants | Central America | 0.6 /100 | #259 | Tragic 9.5% |
| Italians | 0.6 /100 | #260 | Tragic 9.5% |
| South Americans | 0.5 /100 | #261 | Tragic 9.5% |
| Senegalese | 0.5 /100 | #262 | Tragic 9.5% |
| Lebanese | 0.5 /100 | #263 | Tragic 9.5% |
| Immigrants | Ghana | 0.4 /100 | #264 | Tragic 9.5% |
| West Indians | 0.4 /100 | #265 | Tragic 9.5% |
| Immigrants | Jamaica | 0.3 /100 | #266 | Tragic 9.5% |
| Irish | 0.3 /100 | #267 | Tragic 9.5% |
| Ghanaians | 0.2 /100 | #268 | Tragic 9.6% |
| Blackfeet | 0.2 /100 | #269 | Tragic 9.6% |
| Immigrants | Nicaragua | 0.2 /100 | #270 | Tragic 9.6% |
| Immigrants | Latin America | 0.1 /100 | #271 | Tragic 9.6% |
| Kiowa | 0.1 /100 | #272 | Tragic 9.6% |
Demographics Similar to Immigrants from Italy by Unemployment Among Women with Children Ages 6 to 17 years
In terms of unemployment among women with children ages 6 to 17 years, the demographic groups most similar to Immigrants from Italy are Immigrants from Sierra Leone (9.0%, a difference of 0.10%), Immigrants from Jordan (9.0%, a difference of 0.10%), Menominee (9.0%, a difference of 0.20%), Immigrants from Zaire (9.0%, a difference of 0.25%), and Immigrants from Costa Rica (9.0%, a difference of 0.28%).
| Demographics | Rating | Rank | Unemployment Among Women with Children Ages 6 to 17 years |
| British | 55.2 /100 | #169 | Average 8.9% |
| Turks | 54.1 /100 | #170 | Average 8.9% |
| Jordanians | 52.2 /100 | #171 | Average 9.0% |
| Immigrants | West Indies | 52.2 /100 | #172 | Average 9.0% |
| Immigrants | Brazil | 51.0 /100 | #173 | Average 9.0% |
| Immigrants | Costa Rica | 50.0 /100 | #174 | Average 9.0% |
| Immigrants | Sierra Leone | 45.9 /100 | #175 | Average 9.0% |
| Immigrants | Italy | 43.7 /100 | #176 | Average 9.0% |
| Immigrants | Jordan | 41.6 /100 | #177 | Average 9.0% |
| Menominee | 39.3 /100 | #178 | Fair 9.0% |
| Immigrants | Zaire | 38.3 /100 | #179 | Fair 9.0% |
| Ethiopians | 37.6 /100 | #180 | Fair 9.0% |
| Immigrants | Czechoslovakia | 34.5 /100 | #181 | Fair 9.0% |
| South American Indians | 34.4 /100 | #182 | Fair 9.0% |
| Swiss | 33.5 /100 | #183 | Fair 9.0% |