Yakama vs Immigrants from Poland Unemployment Among Women with Children Ages 6 to 17 years
COMPARE
Yakama
Immigrants from Poland
Unemployment Among Women with Children Ages 6 to 17 years
Unemployment Among Women with Children Ages 6 to 17 years Comparison
Yakama
Immigrants from Poland
9.9%
UNEMPLOYMENT AMONG WOMEN WITH CHILDREN AGES 6 TO 17 YEARS
0.0/ 100
METRIC RATING
284th/ 347
METRIC RANK
8.8%
UNEMPLOYMENT AMONG WOMEN WITH CHILDREN AGES 6 TO 17 YEARS
88.3/ 100
METRIC RATING
140th/ 347
METRIC RANK
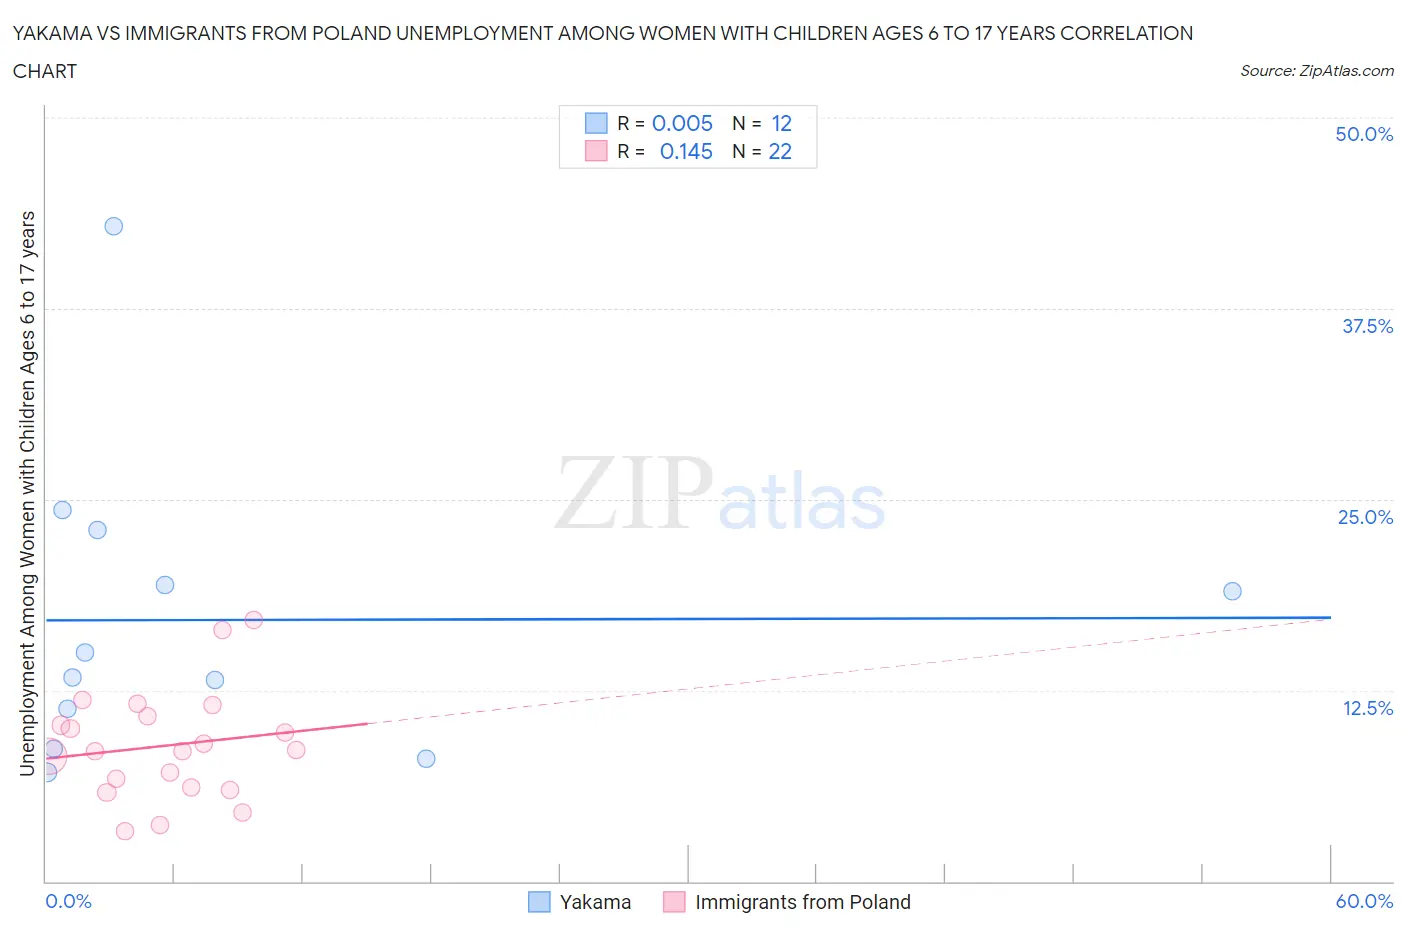
Yakama vs Immigrants from Poland Unemployment Among Women with Children Ages 6 to 17 years Correlation Chart
The statistical analysis conducted on geographies consisting of 17,342,387 people shows no correlation between the proportion of Yakama and unemployment rate among women with children between the ages 6 and 17 in the United States with a correlation coefficient (R) of 0.005 and weighted average of 9.9%. Similarly, the statistical analysis conducted on geographies consisting of 224,450,352 people shows a poor positive correlation between the proportion of Immigrants from Poland and unemployment rate among women with children between the ages 6 and 17 in the United States with a correlation coefficient (R) of 0.145 and weighted average of 8.8%, a difference of 12.8%.
Unemployment Among Women with Children Ages 6 to 17 years Correlation Summary
| Measurement | Yakama | Immigrants from Poland |
| Minimum | 7.1% | 3.3% |
| Maximum | 42.9% | 17.1% |
| Range | 35.8% | 13.8% |
| Mean | 17.1% | 8.9% |
| Median | 14.2% | 8.5% |
| Interquartile 25% (IQ1) | 10.0% | 6.1% |
| Interquartile 75% (IQ3) | 21.2% | 10.8% |
| Interquartile Range (IQR) | 11.2% | 4.7% |
| Standard Deviation (Sample) | 9.9% | 3.6% |
| Standard Deviation (Population) | 9.5% | 3.5% |
Similar Demographics by Unemployment Among Women with Children Ages 6 to 17 years
Demographics Similar to Yakama by Unemployment Among Women with Children Ages 6 to 17 years
In terms of unemployment among women with children ages 6 to 17 years, the demographic groups most similar to Yakama are Central American Indian (9.9%, a difference of 0.15%), Hispanic or Latino (9.9%, a difference of 0.31%), Choctaw (9.9%, a difference of 0.43%), Sierra Leonean (9.9%, a difference of 0.47%), and Shoshone (10.0%, a difference of 0.72%).
| Demographics | Rating | Rank | Unemployment Among Women with Children Ages 6 to 17 years |
| British West Indians | 0.1 /100 | #277 | Tragic 9.7% |
| French | 0.1 /100 | #278 | Tragic 9.7% |
| Scotch-Irish | 0.1 /100 | #279 | Tragic 9.7% |
| Seminole | 0.1 /100 | #280 | Tragic 9.7% |
| Jamaicans | 0.0 /100 | #281 | Tragic 9.8% |
| Slovaks | 0.0 /100 | #282 | Tragic 9.8% |
| Central American Indians | 0.0 /100 | #283 | Tragic 9.9% |
| Yakama | 0.0 /100 | #284 | Tragic 9.9% |
| Hispanics or Latinos | 0.0 /100 | #285 | Tragic 9.9% |
| Choctaw | 0.0 /100 | #286 | Tragic 9.9% |
| Sierra Leoneans | 0.0 /100 | #287 | Tragic 9.9% |
| Shoshone | 0.0 /100 | #288 | Tragic 10.0% |
| Hondurans | 0.0 /100 | #289 | Tragic 10.0% |
| Sub-Saharan Africans | 0.0 /100 | #290 | Tragic 10.0% |
| Immigrants | Nonimmigrants | 0.0 /100 | #291 | Tragic 10.0% |
Demographics Similar to Immigrants from Poland by Unemployment Among Women with Children Ages 6 to 17 years
In terms of unemployment among women with children ages 6 to 17 years, the demographic groups most similar to Immigrants from Poland are Serbian (8.8%, a difference of 0.070%), Immigrants from Austria (8.8%, a difference of 0.080%), Northern European (8.8%, a difference of 0.11%), Immigrants from Ethiopia (8.8%, a difference of 0.14%), and Immigrants from Argentina (8.7%, a difference of 0.20%).
| Demographics | Rating | Rank | Unemployment Among Women with Children Ages 6 to 17 years |
| Egyptians | 91.8 /100 | #133 | Exceptional 8.7% |
| Immigrants | Ireland | 91.0 /100 | #134 | Exceptional 8.7% |
| Europeans | 90.6 /100 | #135 | Exceptional 8.7% |
| Immigrants | Latvia | 90.4 /100 | #136 | Exceptional 8.7% |
| Immigrants | Argentina | 90.0 /100 | #137 | Excellent 8.7% |
| Immigrants | Ethiopia | 89.5 /100 | #138 | Excellent 8.8% |
| Northern Europeans | 89.2 /100 | #139 | Excellent 8.8% |
| Immigrants | Poland | 88.3 /100 | #140 | Excellent 8.8% |
| Serbians | 87.6 /100 | #141 | Excellent 8.8% |
| Immigrants | Austria | 87.5 /100 | #142 | Excellent 8.8% |
| Immigrants | Kenya | 86.1 /100 | #143 | Excellent 8.8% |
| Russians | 85.8 /100 | #144 | Excellent 8.8% |
| Kenyans | 85.6 /100 | #145 | Excellent 8.8% |
| Chileans | 80.8 /100 | #146 | Excellent 8.8% |
| Immigrants | Bangladesh | 79.4 /100 | #147 | Good 8.8% |