Yakama vs Pakistani Unemployment Among Women with Children Ages 6 to 17 years
COMPARE
Yakama
Pakistani
Unemployment Among Women with Children Ages 6 to 17 years
Unemployment Among Women with Children Ages 6 to 17 years Comparison
Yakama
Pakistanis
9.9%
UNEMPLOYMENT AMONG WOMEN WITH CHILDREN AGES 6 TO 17 YEARS
0.0/ 100
METRIC RATING
284th/ 347
METRIC RANK
8.4%
UNEMPLOYMENT AMONG WOMEN WITH CHILDREN AGES 6 TO 17 YEARS
99.6/ 100
METRIC RATING
78th/ 347
METRIC RANK
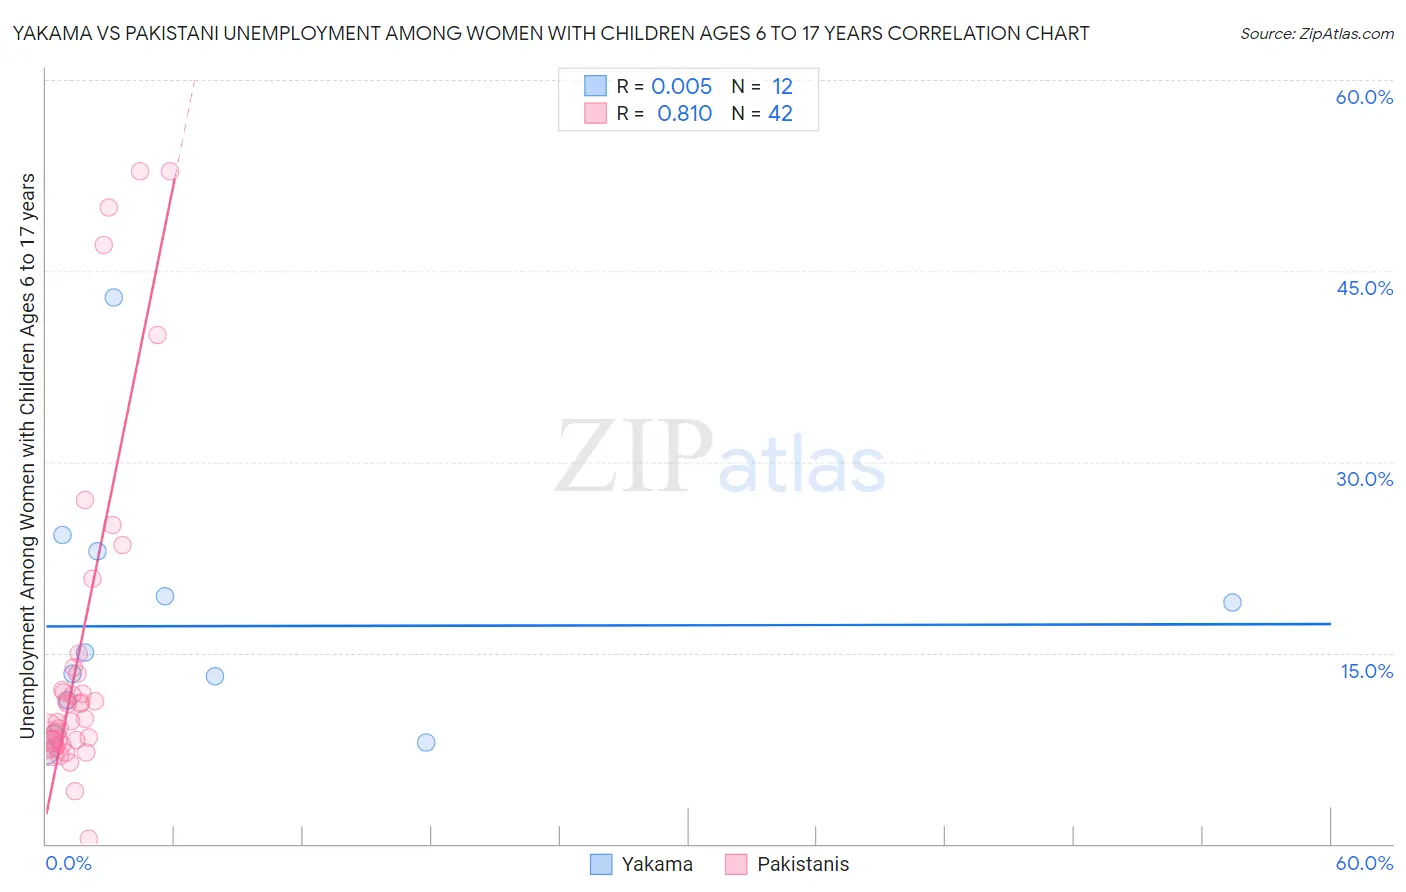
Yakama vs Pakistani Unemployment Among Women with Children Ages 6 to 17 years Correlation Chart
The statistical analysis conducted on geographies consisting of 17,342,387 people shows no correlation between the proportion of Yakama and unemployment rate among women with children between the ages 6 and 17 in the United States with a correlation coefficient (R) of 0.005 and weighted average of 9.9%. Similarly, the statistical analysis conducted on geographies consisting of 251,939,876 people shows a very strong positive correlation between the proportion of Pakistanis and unemployment rate among women with children between the ages 6 and 17 in the United States with a correlation coefficient (R) of 0.810 and weighted average of 8.4%, a difference of 17.6%.
Unemployment Among Women with Children Ages 6 to 17 years Correlation Summary
| Measurement | Yakama | Pakistani |
| Minimum | 7.1% | 0.40% |
| Maximum | 42.9% | 52.8% |
| Range | 35.8% | 52.4% |
| Mean | 17.1% | 15.3% |
| Median | 14.2% | 10.4% |
| Interquartile 25% (IQ1) | 10.0% | 8.0% |
| Interquartile 75% (IQ3) | 21.2% | 13.8% |
| Interquartile Range (IQR) | 11.2% | 5.8% |
| Standard Deviation (Sample) | 9.9% | 13.5% |
| Standard Deviation (Population) | 9.5% | 13.3% |
Similar Demographics by Unemployment Among Women with Children Ages 6 to 17 years
Demographics Similar to Yakama by Unemployment Among Women with Children Ages 6 to 17 years
In terms of unemployment among women with children ages 6 to 17 years, the demographic groups most similar to Yakama are Central American Indian (9.9%, a difference of 0.15%), Hispanic or Latino (9.9%, a difference of 0.31%), Choctaw (9.9%, a difference of 0.43%), Sierra Leonean (9.9%, a difference of 0.47%), and Shoshone (10.0%, a difference of 0.72%).
| Demographics | Rating | Rank | Unemployment Among Women with Children Ages 6 to 17 years |
| British West Indians | 0.1 /100 | #277 | Tragic 9.7% |
| French | 0.1 /100 | #278 | Tragic 9.7% |
| Scotch-Irish | 0.1 /100 | #279 | Tragic 9.7% |
| Seminole | 0.1 /100 | #280 | Tragic 9.7% |
| Jamaicans | 0.0 /100 | #281 | Tragic 9.8% |
| Slovaks | 0.0 /100 | #282 | Tragic 9.8% |
| Central American Indians | 0.0 /100 | #283 | Tragic 9.9% |
| Yakama | 0.0 /100 | #284 | Tragic 9.9% |
| Hispanics or Latinos | 0.0 /100 | #285 | Tragic 9.9% |
| Choctaw | 0.0 /100 | #286 | Tragic 9.9% |
| Sierra Leoneans | 0.0 /100 | #287 | Tragic 9.9% |
| Shoshone | 0.0 /100 | #288 | Tragic 10.0% |
| Hondurans | 0.0 /100 | #289 | Tragic 10.0% |
| Sub-Saharan Africans | 0.0 /100 | #290 | Tragic 10.0% |
| Immigrants | Nonimmigrants | 0.0 /100 | #291 | Tragic 10.0% |
Demographics Similar to Pakistanis by Unemployment Among Women with Children Ages 6 to 17 years
In terms of unemployment among women with children ages 6 to 17 years, the demographic groups most similar to Pakistanis are Mongolian (8.4%, a difference of 0.010%), Immigrants from Belarus (8.4%, a difference of 0.050%), Iraqi (8.4%, a difference of 0.14%), Immigrants from Bolivia (8.4%, a difference of 0.17%), and Immigrants from Moldova (8.4%, a difference of 0.19%).
| Demographics | Rating | Rank | Unemployment Among Women with Children Ages 6 to 17 years |
| Immigrants | Australia | 99.8 /100 | #71 | Exceptional 8.3% |
| Immigrants | Nepal | 99.8 /100 | #72 | Exceptional 8.3% |
| Spanish Americans | 99.8 /100 | #73 | Exceptional 8.4% |
| Samoans | 99.7 /100 | #74 | Exceptional 8.4% |
| Immigrants | Sri Lanka | 99.7 /100 | #75 | Exceptional 8.4% |
| Immigrants | Moldova | 99.7 /100 | #76 | Exceptional 8.4% |
| Iraqis | 99.7 /100 | #77 | Exceptional 8.4% |
| Pakistanis | 99.6 /100 | #78 | Exceptional 8.4% |
| Mongolians | 99.6 /100 | #79 | Exceptional 8.4% |
| Immigrants | Belarus | 99.6 /100 | #80 | Exceptional 8.4% |
| Immigrants | Bolivia | 99.6 /100 | #81 | Exceptional 8.4% |
| Cypriots | 99.6 /100 | #82 | Exceptional 8.4% |
| Bulgarians | 99.5 /100 | #83 | Exceptional 8.4% |
| Japanese | 99.5 /100 | #84 | Exceptional 8.4% |
| Immigrants | North Macedonia | 99.4 /100 | #85 | Exceptional 8.5% |