Tsimshian vs Immigrants from Cameroon Unemployment
COMPARE
Tsimshian
Immigrants from Cameroon
Unemployment
Unemployment Comparison
Tsimshian
Immigrants from Cameroon
7.2%
UNEMPLOYMENT
0.0/ 100
METRIC RATING
328th/ 347
METRIC RANK
5.6%
UNEMPLOYMENT
1.0/ 100
METRIC RATING
247th/ 347
METRIC RANK
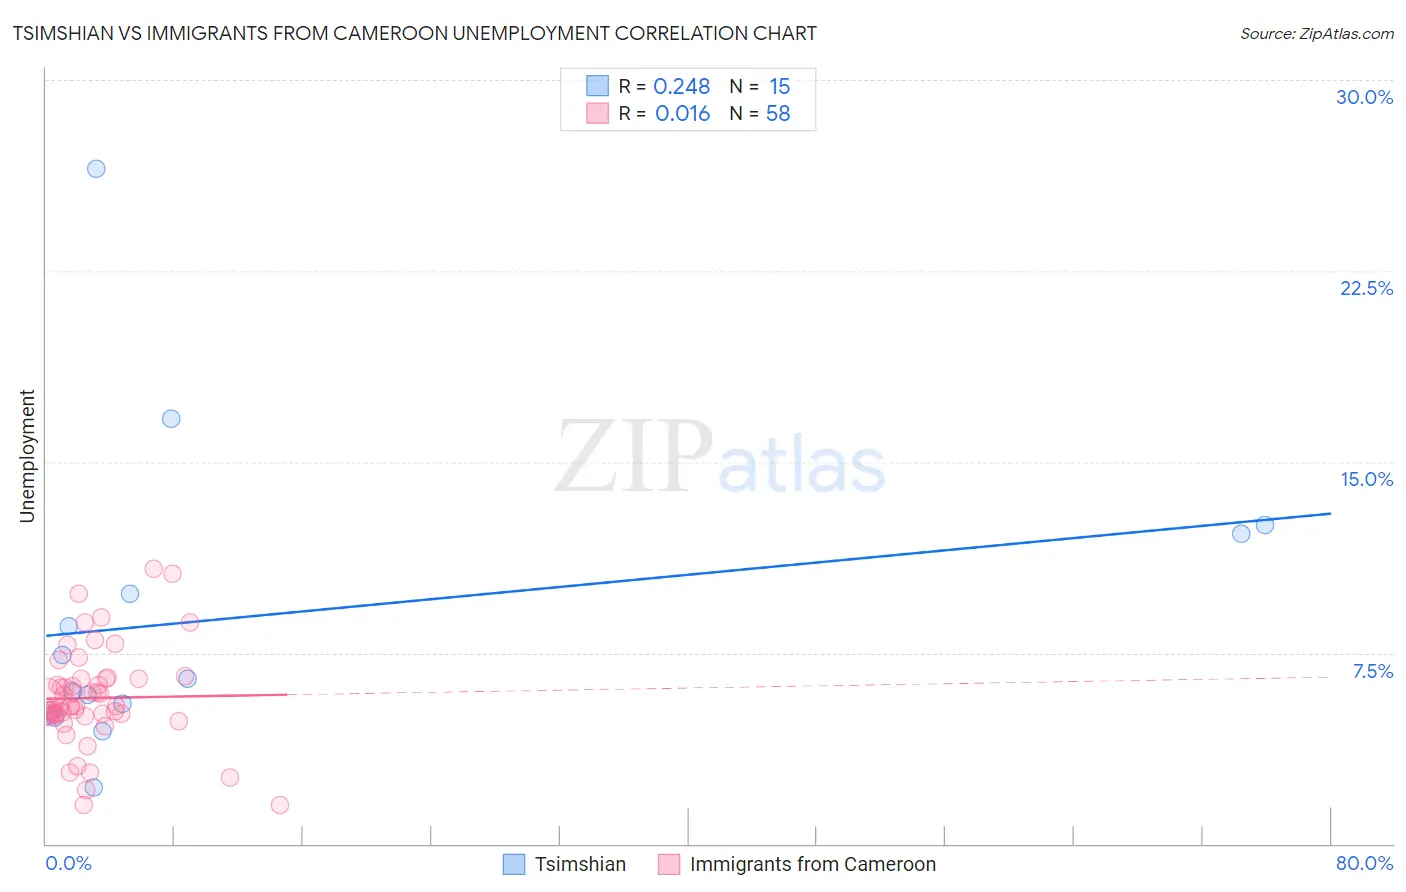
Tsimshian vs Immigrants from Cameroon Unemployment Correlation Chart
The statistical analysis conducted on geographies consisting of 15,625,029 people shows a weak positive correlation between the proportion of Tsimshian and unemployment in the United States with a correlation coefficient (R) of 0.248 and weighted average of 7.2%. Similarly, the statistical analysis conducted on geographies consisting of 130,734,727 people shows no correlation between the proportion of Immigrants from Cameroon and unemployment in the United States with a correlation coefficient (R) of 0.016 and weighted average of 5.6%, a difference of 28.3%.
Unemployment Correlation Summary
| Measurement | Tsimshian | Immigrants from Cameroon |
| Minimum | 2.2% | 1.5% |
| Maximum | 26.5% | 10.8% |
| Range | 24.3% | 9.3% |
| Mean | 8.9% | 5.7% |
| Median | 6.5% | 5.4% |
| Interquartile 25% (IQ1) | 5.1% | 5.1% |
| Interquartile 75% (IQ3) | 12.2% | 6.5% |
| Interquartile Range (IQR) | 7.1% | 1.4% |
| Standard Deviation (Sample) | 6.1% | 1.9% |
| Standard Deviation (Population) | 5.9% | 1.9% |
Similar Demographics by Unemployment
Demographics Similar to Tsimshian by Unemployment
In terms of unemployment, the demographic groups most similar to Tsimshian are Alaska Native (7.2%, a difference of 0.31%), Pueblo (7.2%, a difference of 0.91%), Paiute (7.1%, a difference of 1.4%), Yakama (7.3%, a difference of 1.6%), and Dominican (7.4%, a difference of 1.9%).
| Demographics | Rating | Rank | Unemployment |
| Immigrants | Guyana | 0.0 /100 | #321 | Tragic 6.9% |
| Guyanese | 0.0 /100 | #322 | Tragic 6.9% |
| Immigrants | Grenada | 0.0 /100 | #323 | Tragic 6.9% |
| Immigrants | Armenia | 0.0 /100 | #324 | Tragic 7.0% |
| Natives/Alaskans | 0.0 /100 | #325 | Tragic 7.0% |
| Paiute | 0.0 /100 | #326 | Tragic 7.1% |
| Pueblo | 0.0 /100 | #327 | Tragic 7.2% |
| Tsimshian | 0.0 /100 | #328 | Tragic 7.2% |
| Alaska Natives | 0.0 /100 | #329 | Tragic 7.2% |
| Yakama | 0.0 /100 | #330 | Tragic 7.3% |
| Dominicans | 0.0 /100 | #331 | Tragic 7.4% |
| Sioux | 0.0 /100 | #332 | Tragic 7.4% |
| Immigrants | Dominican Republic | 0.0 /100 | #333 | Tragic 7.4% |
| Apache | 0.0 /100 | #334 | Tragic 7.4% |
| Alaskan Athabascans | 0.0 /100 | #335 | Tragic 7.7% |
Demographics Similar to Immigrants from Cameroon by Unemployment
In terms of unemployment, the demographic groups most similar to Immigrants from Cameroon are Liberian (5.6%, a difference of 0.13%), Bermudan (5.6%, a difference of 0.15%), French American Indian (5.6%, a difference of 0.19%), Dutch West Indian (5.6%, a difference of 0.21%), and Marshallese (5.6%, a difference of 0.36%).
| Demographics | Rating | Rank | Unemployment |
| Cree | 2.6 /100 | #240 | Tragic 5.6% |
| Tlingit-Haida | 2.0 /100 | #241 | Tragic 5.6% |
| Spanish Americans | 2.0 /100 | #242 | Tragic 5.6% |
| Marshallese | 1.3 /100 | #243 | Tragic 5.6% |
| Dutch West Indians | 1.2 /100 | #244 | Tragic 5.6% |
| French American Indians | 1.2 /100 | #245 | Tragic 5.6% |
| Bermudans | 1.1 /100 | #246 | Tragic 5.6% |
| Immigrants | Cameroon | 1.0 /100 | #247 | Tragic 5.6% |
| Liberians | 0.9 /100 | #248 | Tragic 5.6% |
| Cajuns | 0.8 /100 | #249 | Tragic 5.6% |
| Japanese | 0.8 /100 | #250 | Tragic 5.6% |
| Kiowa | 0.6 /100 | #251 | Tragic 5.7% |
| Hondurans | 0.3 /100 | #252 | Tragic 5.7% |
| Central Americans | 0.3 /100 | #253 | Tragic 5.7% |
| Immigrants | Honduras | 0.3 /100 | #254 | Tragic 5.7% |