Tsimshian vs Norwegian Unemployment
COMPARE
Tsimshian
Norwegian
Unemployment
Unemployment Comparison
Tsimshian
Norwegians
7.2%
UNEMPLOYMENT
0.0/ 100
METRIC RATING
328th/ 347
METRIC RANK
4.2%
UNEMPLOYMENT
100.0/ 100
METRIC RATING
1st/ 347
METRIC RANK
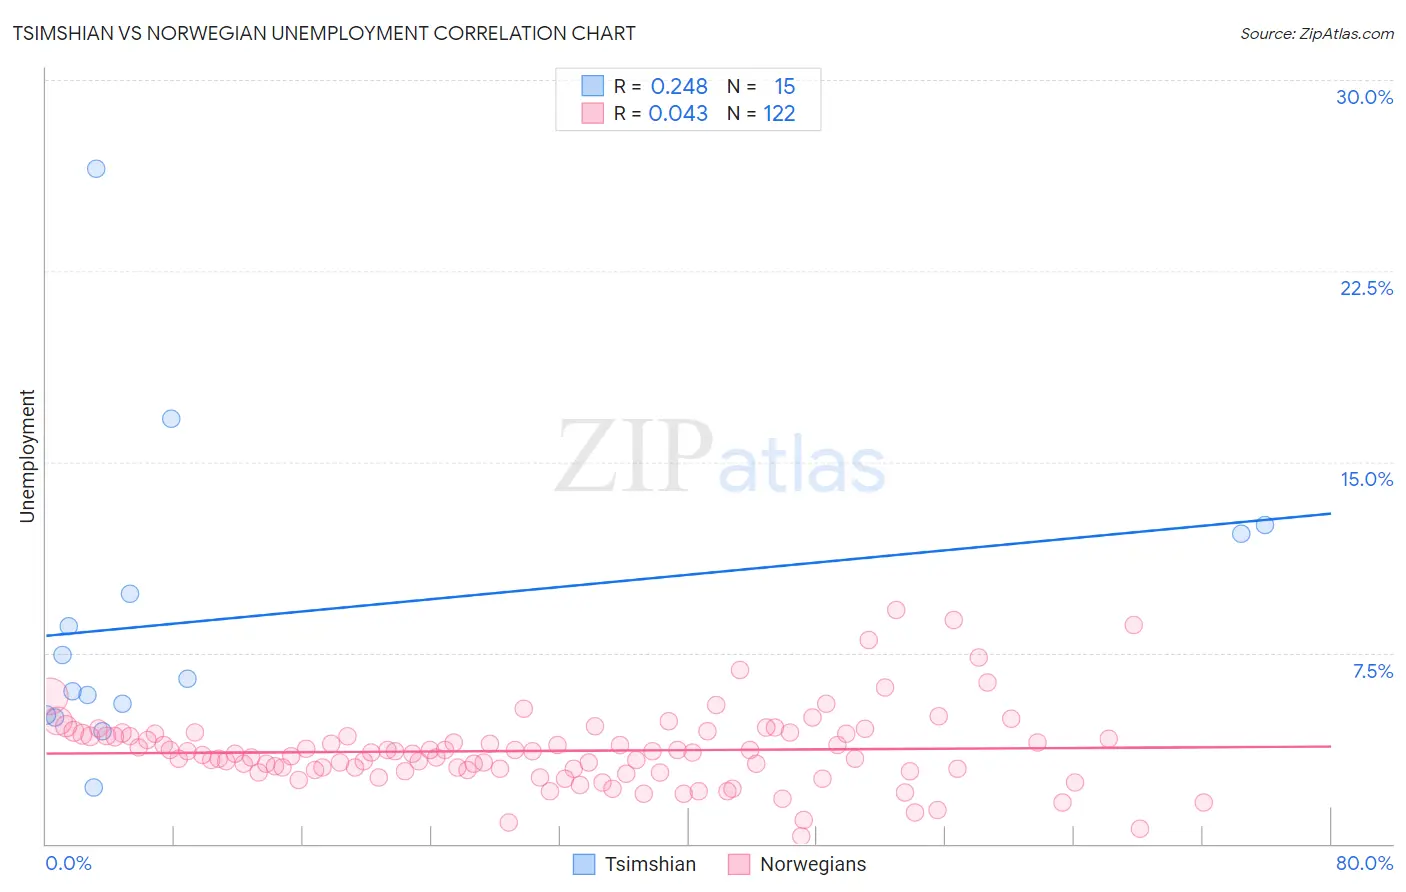
Tsimshian vs Norwegian Unemployment Correlation Chart
The statistical analysis conducted on geographies consisting of 15,625,029 people shows a weak positive correlation between the proportion of Tsimshian and unemployment in the United States with a correlation coefficient (R) of 0.248 and weighted average of 7.2%. Similarly, the statistical analysis conducted on geographies consisting of 530,614,839 people shows no correlation between the proportion of Norwegians and unemployment in the United States with a correlation coefficient (R) of 0.043 and weighted average of 4.2%, a difference of 72.0%.
Unemployment Correlation Summary
| Measurement | Tsimshian | Norwegian |
| Minimum | 2.2% | 0.30% |
| Maximum | 26.5% | 9.2% |
| Range | 24.3% | 8.9% |
| Mean | 8.9% | 3.6% |
| Median | 6.5% | 3.6% |
| Interquartile 25% (IQ1) | 5.1% | 2.9% |
| Interquartile 75% (IQ3) | 12.2% | 4.3% |
| Interquartile Range (IQR) | 7.1% | 1.4% |
| Standard Deviation (Sample) | 6.1% | 1.5% |
| Standard Deviation (Population) | 5.9% | 1.5% |
Similar Demographics by Unemployment
Demographics Similar to Tsimshian by Unemployment
In terms of unemployment, the demographic groups most similar to Tsimshian are Alaska Native (7.2%, a difference of 0.31%), Pueblo (7.2%, a difference of 0.91%), Paiute (7.1%, a difference of 1.4%), Yakama (7.3%, a difference of 1.6%), and Dominican (7.4%, a difference of 1.9%).
| Demographics | Rating | Rank | Unemployment |
| Immigrants | Guyana | 0.0 /100 | #321 | Tragic 6.9% |
| Guyanese | 0.0 /100 | #322 | Tragic 6.9% |
| Immigrants | Grenada | 0.0 /100 | #323 | Tragic 6.9% |
| Immigrants | Armenia | 0.0 /100 | #324 | Tragic 7.0% |
| Natives/Alaskans | 0.0 /100 | #325 | Tragic 7.0% |
| Paiute | 0.0 /100 | #326 | Tragic 7.1% |
| Pueblo | 0.0 /100 | #327 | Tragic 7.2% |
| Tsimshian | 0.0 /100 | #328 | Tragic 7.2% |
| Alaska Natives | 0.0 /100 | #329 | Tragic 7.2% |
| Yakama | 0.0 /100 | #330 | Tragic 7.3% |
| Dominicans | 0.0 /100 | #331 | Tragic 7.4% |
| Sioux | 0.0 /100 | #332 | Tragic 7.4% |
| Immigrants | Dominican Republic | 0.0 /100 | #333 | Tragic 7.4% |
| Apache | 0.0 /100 | #334 | Tragic 7.4% |
| Alaskan Athabascans | 0.0 /100 | #335 | Tragic 7.7% |
Demographics Similar to Norwegians by Unemployment
In terms of unemployment, the demographic groups most similar to Norwegians are Luxembourger (4.3%, a difference of 3.4%), Czech (4.3%, a difference of 3.5%), Danish (4.3%, a difference of 3.6%), Swedish (4.4%, a difference of 6.0%), and German (4.5%, a difference of 6.9%).
| Demographics | Rating | Rank | Unemployment |
| Norwegians | 100.0 /100 | #1 | Exceptional 4.2% |
| Luxembourgers | 100.0 /100 | #2 | Exceptional 4.3% |
| Czechs | 100.0 /100 | #3 | Exceptional 4.3% |
| Danes | 100.0 /100 | #4 | Exceptional 4.3% |
| Swedes | 100.0 /100 | #5 | Exceptional 4.4% |
| Germans | 100.0 /100 | #6 | Exceptional 4.5% |
| Immigrants | India | 100.0 /100 | #7 | Exceptional 4.5% |
| Swiss | 100.0 /100 | #8 | Exceptional 4.5% |
| Scandinavians | 100.0 /100 | #9 | Exceptional 4.5% |
| Dutch | 100.0 /100 | #10 | Exceptional 4.6% |
| English | 100.0 /100 | #11 | Exceptional 4.6% |
| Pennsylvania Germans | 100.0 /100 | #12 | Exceptional 4.6% |
| Belgians | 100.0 /100 | #13 | Exceptional 4.6% |
| Immigrants | Cuba | 100.0 /100 | #14 | Exceptional 4.6% |
| Europeans | 99.9 /100 | #15 | Exceptional 4.6% |