Tsimshian vs Immigrants from Cameroon Receiving Food Stamps
COMPARE
Tsimshian
Immigrants from Cameroon
Receiving Food Stamps
Receiving Food Stamps Comparison
Tsimshian
Immigrants from Cameroon
15.7%
RECEIVING FOOD STAMPS
0.0/ 100
METRIC RATING
296th/ 347
METRIC RANK
12.0%
RECEIVING FOOD STAMPS
32.5/ 100
METRIC RATING
189th/ 347
METRIC RANK
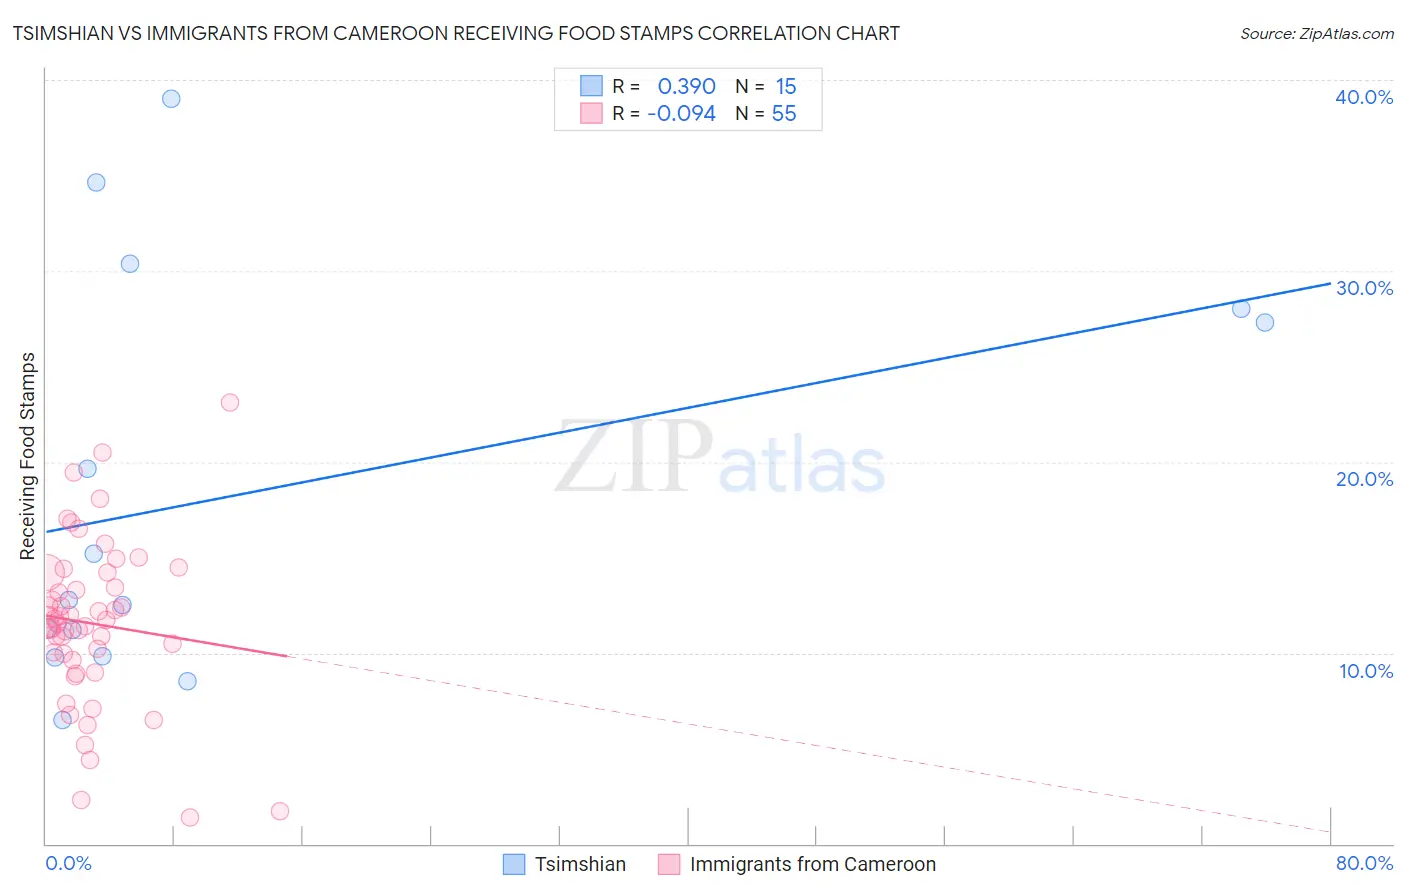
Tsimshian vs Immigrants from Cameroon Receiving Food Stamps Correlation Chart
The statistical analysis conducted on geographies consisting of 15,626,544 people shows a mild positive correlation between the proportion of Tsimshian and percentage of population receiving government assistance and/or food stamps in the United States with a correlation coefficient (R) of 0.390 and weighted average of 15.7%. Similarly, the statistical analysis conducted on geographies consisting of 130,693,457 people shows a slight negative correlation between the proportion of Immigrants from Cameroon and percentage of population receiving government assistance and/or food stamps in the United States with a correlation coefficient (R) of -0.094 and weighted average of 12.0%, a difference of 30.7%.
Receiving Food Stamps Correlation Summary
| Measurement | Tsimshian | Immigrants from Cameroon |
| Minimum | 6.5% | 1.4% |
| Maximum | 39.0% | 23.1% |
| Range | 32.5% | 21.7% |
| Mean | 18.4% | 11.5% |
| Median | 12.8% | 11.7% |
| Interquartile 25% (IQ1) | 9.8% | 9.6% |
| Interquartile 75% (IQ3) | 28.0% | 14.2% |
| Interquartile Range (IQR) | 18.2% | 4.6% |
| Standard Deviation (Sample) | 10.6% | 4.3% |
| Standard Deviation (Population) | 10.2% | 4.3% |
Similar Demographics by Receiving Food Stamps
Demographics Similar to Tsimshian by Receiving Food Stamps
In terms of receiving food stamps, the demographic groups most similar to Tsimshian are Immigrants from Honduras (15.7%, a difference of 0.010%), Immigrants from Bahamas (15.8%, a difference of 0.16%), Immigrants from Latin America (15.7%, a difference of 0.33%), Immigrants from Trinidad and Tobago (15.8%, a difference of 0.41%), and Vietnamese (15.7%, a difference of 0.44%).
| Demographics | Rating | Rank | Receiving Food Stamps |
| Immigrants | Senegal | 0.0 /100 | #289 | Tragic 15.3% |
| Senegalese | 0.0 /100 | #290 | Tragic 15.4% |
| Hondurans | 0.0 /100 | #291 | Tragic 15.5% |
| Alaska Natives | 0.0 /100 | #292 | Tragic 15.6% |
| Vietnamese | 0.0 /100 | #293 | Tragic 15.7% |
| Immigrants | Latin America | 0.0 /100 | #294 | Tragic 15.7% |
| Immigrants | Honduras | 0.0 /100 | #295 | Tragic 15.7% |
| Tsimshian | 0.0 /100 | #296 | Tragic 15.7% |
| Immigrants | Bahamas | 0.0 /100 | #297 | Tragic 15.8% |
| Immigrants | Trinidad and Tobago | 0.0 /100 | #298 | Tragic 15.8% |
| Hispanics or Latinos | 0.0 /100 | #299 | Tragic 15.8% |
| Immigrants | Bangladesh | 0.0 /100 | #300 | Tragic 15.9% |
| Trinidadians and Tobagonians | 0.0 /100 | #301 | Tragic 16.0% |
| Immigrants | West Indies | 0.0 /100 | #302 | Tragic 16.1% |
| Nicaraguans | 0.0 /100 | #303 | Tragic 16.1% |
Demographics Similar to Immigrants from Cameroon by Receiving Food Stamps
In terms of receiving food stamps, the demographic groups most similar to Immigrants from Cameroon are Immigrants from Peru (12.0%, a difference of 0.060%), Venezuelan (12.0%, a difference of 0.060%), Sudanese (12.0%, a difference of 0.14%), Samoan (12.1%, a difference of 0.24%), and Albanian (12.0%, a difference of 0.44%).
| Demographics | Rating | Rank | Receiving Food Stamps |
| Immigrants | Morocco | 40.7 /100 | #182 | Average 11.9% |
| Immigrants | Uganda | 40.3 /100 | #183 | Average 11.9% |
| Spaniards | 39.8 /100 | #184 | Fair 11.9% |
| Immigrants | Iraq | 37.1 /100 | #185 | Fair 12.0% |
| Spanish | 36.9 /100 | #186 | Fair 12.0% |
| Albanians | 35.4 /100 | #187 | Fair 12.0% |
| Sudanese | 33.4 /100 | #188 | Fair 12.0% |
| Immigrants | Cameroon | 32.5 /100 | #189 | Fair 12.0% |
| Immigrants | Peru | 32.2 /100 | #190 | Fair 12.0% |
| Venezuelans | 32.1 /100 | #191 | Fair 12.0% |
| Samoans | 31.0 /100 | #192 | Fair 12.1% |
| Immigrants | Fiji | 27.8 /100 | #193 | Fair 12.1% |
| Immigrants | Sudan | 27.1 /100 | #194 | Fair 12.1% |
| Americans | 26.7 /100 | #195 | Fair 12.2% |
| Iraqis | 26.6 /100 | #196 | Fair 12.2% |