Immigrants from Nicaragua vs Immigrants from Cameroon Unemployment
COMPARE
Immigrants from Nicaragua
Immigrants from Cameroon
Unemployment
Unemployment Comparison
Immigrants from Nicaragua
Immigrants from Cameroon
5.2%
UNEMPLOYMENT
57.1/ 100
METRIC RATING
170th/ 347
METRIC RANK
5.6%
UNEMPLOYMENT
1.0/ 100
METRIC RATING
247th/ 347
METRIC RANK
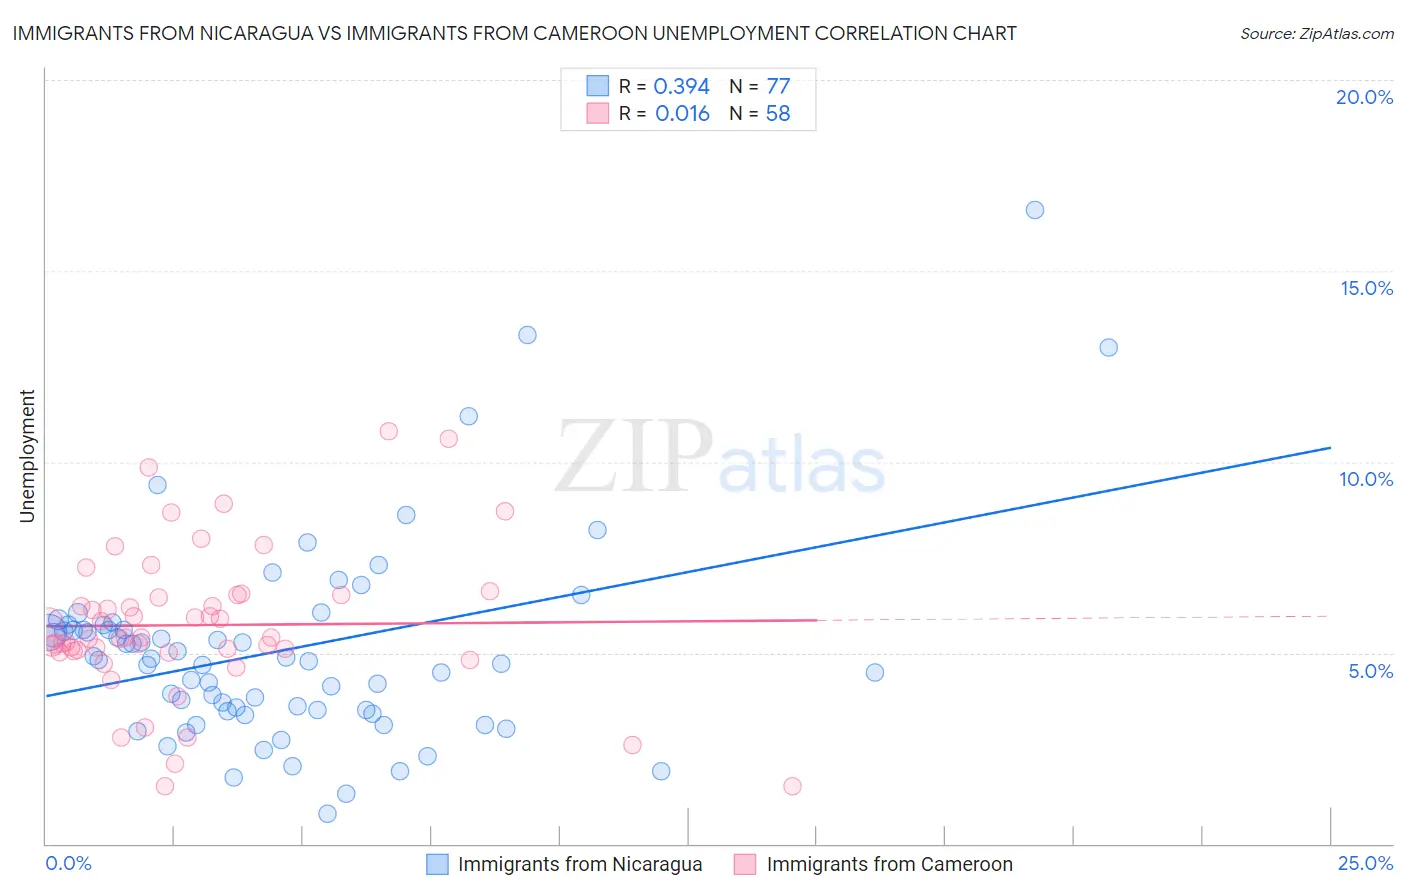
Immigrants from Nicaragua vs Immigrants from Cameroon Unemployment Correlation Chart
The statistical analysis conducted on geographies consisting of 236,258,373 people shows a mild positive correlation between the proportion of Immigrants from Nicaragua and unemployment in the United States with a correlation coefficient (R) of 0.394 and weighted average of 5.2%. Similarly, the statistical analysis conducted on geographies consisting of 130,734,727 people shows no correlation between the proportion of Immigrants from Cameroon and unemployment in the United States with a correlation coefficient (R) of 0.016 and weighted average of 5.6%, a difference of 7.5%.
Unemployment Correlation Summary
| Measurement | Immigrants from Nicaragua | Immigrants from Cameroon |
| Minimum | 0.80% | 1.5% |
| Maximum | 16.6% | 10.8% |
| Range | 15.8% | 9.3% |
| Mean | 5.1% | 5.7% |
| Median | 4.8% | 5.4% |
| Interquartile 25% (IQ1) | 3.5% | 5.1% |
| Interquartile 75% (IQ3) | 5.7% | 6.5% |
| Interquartile Range (IQR) | 2.2% | 1.4% |
| Standard Deviation (Sample) | 2.6% | 1.9% |
| Standard Deviation (Population) | 2.6% | 1.9% |
Similar Demographics by Unemployment
Demographics Similar to Immigrants from Nicaragua by Unemployment
In terms of unemployment, the demographic groups most similar to Immigrants from Nicaragua are Puget Sound Salish (5.2%, a difference of 0.040%), Immigrants from Morocco (5.2%, a difference of 0.12%), Uruguayan (5.2%, a difference of 0.19%), Colombian (5.2%, a difference of 0.25%), and Immigrants from Indonesia (5.2%, a difference of 0.26%).
| Demographics | Rating | Rank | Unemployment |
| Immigrants | Zaire | 64.7 /100 | #163 | Good 5.2% |
| Immigrants | Colombia | 64.7 /100 | #164 | Good 5.2% |
| Immigrants | Brazil | 63.1 /100 | #165 | Good 5.2% |
| Immigrants | Indonesia | 61.2 /100 | #166 | Good 5.2% |
| Colombians | 61.1 /100 | #167 | Good 5.2% |
| Uruguayans | 60.2 /100 | #168 | Good 5.2% |
| Immigrants | Morocco | 59.1 /100 | #169 | Average 5.2% |
| Immigrants | Nicaragua | 57.1 /100 | #170 | Average 5.2% |
| Puget Sound Salish | 56.6 /100 | #171 | Average 5.2% |
| Immigrants | Vietnam | 52.5 /100 | #172 | Average 5.2% |
| Immigrants | Poland | 51.8 /100 | #173 | Average 5.3% |
| Immigrants | Congo | 50.0 /100 | #174 | Average 5.3% |
| Taiwanese | 49.6 /100 | #175 | Average 5.3% |
| Nicaraguans | 48.7 /100 | #176 | Average 5.3% |
| Immigrants | Nonimmigrants | 47.9 /100 | #177 | Average 5.3% |
Demographics Similar to Immigrants from Cameroon by Unemployment
In terms of unemployment, the demographic groups most similar to Immigrants from Cameroon are Liberian (5.6%, a difference of 0.13%), Bermudan (5.6%, a difference of 0.15%), French American Indian (5.6%, a difference of 0.19%), Dutch West Indian (5.6%, a difference of 0.21%), and Marshallese (5.6%, a difference of 0.36%).
| Demographics | Rating | Rank | Unemployment |
| Cree | 2.6 /100 | #240 | Tragic 5.6% |
| Tlingit-Haida | 2.0 /100 | #241 | Tragic 5.6% |
| Spanish Americans | 2.0 /100 | #242 | Tragic 5.6% |
| Marshallese | 1.3 /100 | #243 | Tragic 5.6% |
| Dutch West Indians | 1.2 /100 | #244 | Tragic 5.6% |
| French American Indians | 1.2 /100 | #245 | Tragic 5.6% |
| Bermudans | 1.1 /100 | #246 | Tragic 5.6% |
| Immigrants | Cameroon | 1.0 /100 | #247 | Tragic 5.6% |
| Liberians | 0.9 /100 | #248 | Tragic 5.6% |
| Cajuns | 0.8 /100 | #249 | Tragic 5.6% |
| Japanese | 0.8 /100 | #250 | Tragic 5.6% |
| Kiowa | 0.6 /100 | #251 | Tragic 5.7% |
| Hondurans | 0.3 /100 | #252 | Tragic 5.7% |
| Central Americans | 0.3 /100 | #253 | Tragic 5.7% |
| Immigrants | Honduras | 0.3 /100 | #254 | Tragic 5.7% |