Tsimshian vs Scottish Unemployment
COMPARE
Tsimshian
Scottish
Unemployment
Unemployment Comparison
Tsimshian
Scottish
7.2%
UNEMPLOYMENT
0.0/ 100
METRIC RATING
328th/ 347
METRIC RANK
4.7%
UNEMPLOYMENT
99.9/ 100
METRIC RATING
19th/ 347
METRIC RANK
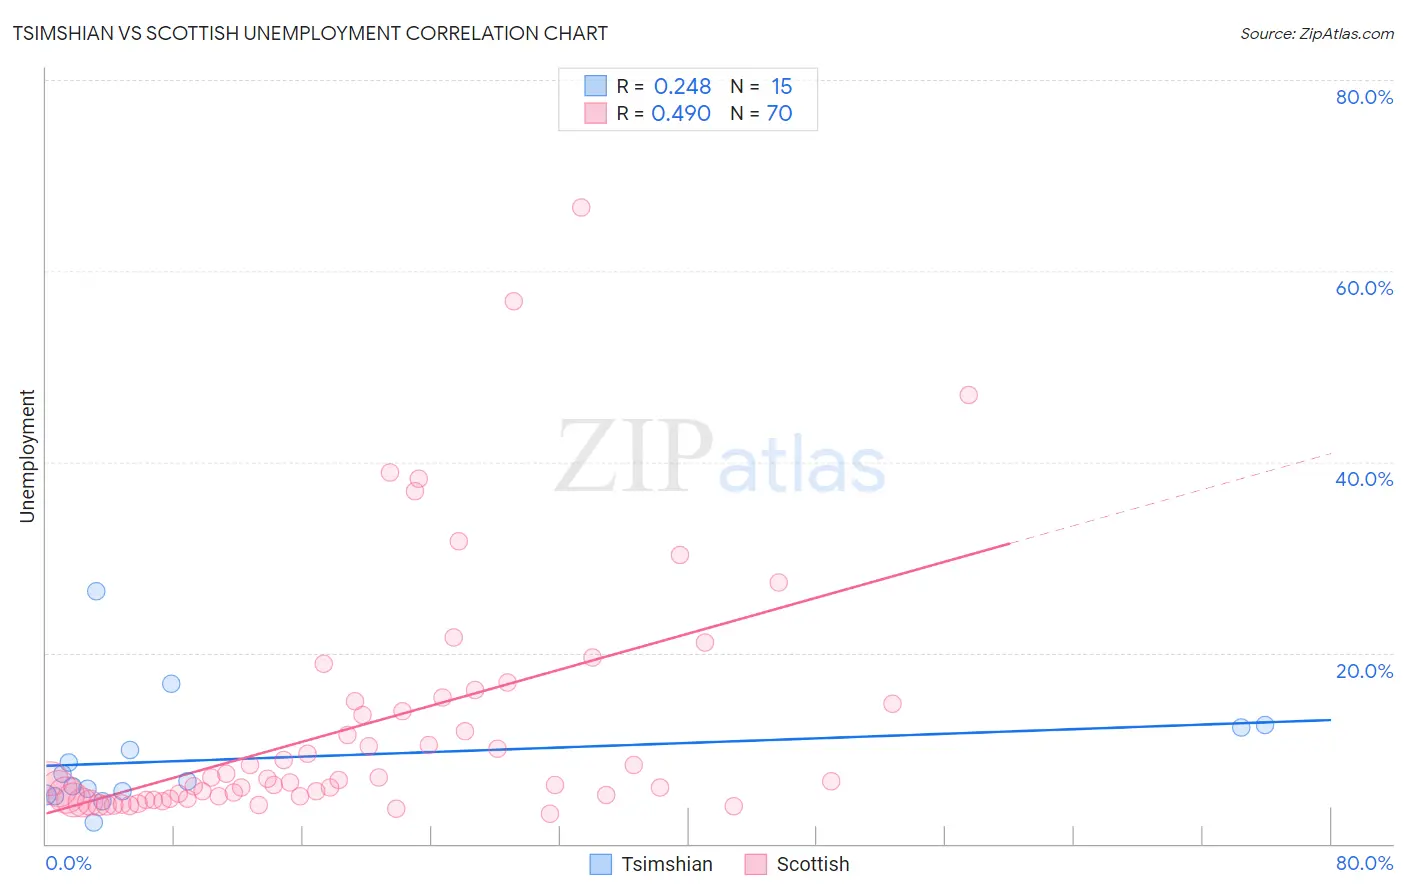
Tsimshian vs Scottish Unemployment Correlation Chart
The statistical analysis conducted on geographies consisting of 15,625,029 people shows a weak positive correlation between the proportion of Tsimshian and unemployment in the United States with a correlation coefficient (R) of 0.248 and weighted average of 7.2%. Similarly, the statistical analysis conducted on geographies consisting of 563,082,415 people shows a moderate positive correlation between the proportion of Scottish and unemployment in the United States with a correlation coefficient (R) of 0.490 and weighted average of 4.7%, a difference of 54.8%.
Unemployment Correlation Summary
| Measurement | Tsimshian | Scottish |
| Minimum | 2.2% | 3.2% |
| Maximum | 26.5% | 66.7% |
| Range | 24.3% | 63.5% |
| Mean | 8.9% | 12.3% |
| Median | 6.5% | 6.6% |
| Interquartile 25% (IQ1) | 5.1% | 4.8% |
| Interquartile 75% (IQ3) | 12.2% | 14.7% |
| Interquartile Range (IQR) | 7.1% | 9.9% |
| Standard Deviation (Sample) | 6.1% | 12.9% |
| Standard Deviation (Population) | 5.9% | 12.8% |
Similar Demographics by Unemployment
Demographics Similar to Tsimshian by Unemployment
In terms of unemployment, the demographic groups most similar to Tsimshian are Alaska Native (7.2%, a difference of 0.31%), Pueblo (7.2%, a difference of 0.91%), Paiute (7.1%, a difference of 1.4%), Yakama (7.3%, a difference of 1.6%), and Dominican (7.4%, a difference of 1.9%).
| Demographics | Rating | Rank | Unemployment |
| Immigrants | Guyana | 0.0 /100 | #321 | Tragic 6.9% |
| Guyanese | 0.0 /100 | #322 | Tragic 6.9% |
| Immigrants | Grenada | 0.0 /100 | #323 | Tragic 6.9% |
| Immigrants | Armenia | 0.0 /100 | #324 | Tragic 7.0% |
| Natives/Alaskans | 0.0 /100 | #325 | Tragic 7.0% |
| Paiute | 0.0 /100 | #326 | Tragic 7.1% |
| Pueblo | 0.0 /100 | #327 | Tragic 7.2% |
| Tsimshian | 0.0 /100 | #328 | Tragic 7.2% |
| Alaska Natives | 0.0 /100 | #329 | Tragic 7.2% |
| Yakama | 0.0 /100 | #330 | Tragic 7.3% |
| Dominicans | 0.0 /100 | #331 | Tragic 7.4% |
| Sioux | 0.0 /100 | #332 | Tragic 7.4% |
| Immigrants | Dominican Republic | 0.0 /100 | #333 | Tragic 7.4% |
| Apache | 0.0 /100 | #334 | Tragic 7.4% |
| Alaskan Athabascans | 0.0 /100 | #335 | Tragic 7.7% |
Demographics Similar to Scottish by Unemployment
In terms of unemployment, the demographic groups most similar to Scottish are Immigrants from Venezuela (4.7%, a difference of 0.080%), Slovene (4.7%, a difference of 0.10%), Chinese (4.7%, a difference of 0.21%), European (4.6%, a difference of 0.35%), and Carpatho Rusyn (4.7%, a difference of 0.59%).
| Demographics | Rating | Rank | Unemployment |
| Pennsylvania Germans | 100.0 /100 | #12 | Exceptional 4.6% |
| Belgians | 100.0 /100 | #13 | Exceptional 4.6% |
| Immigrants | Cuba | 100.0 /100 | #14 | Exceptional 4.6% |
| Europeans | 99.9 /100 | #15 | Exceptional 4.6% |
| Chinese | 99.9 /100 | #16 | Exceptional 4.7% |
| Slovenes | 99.9 /100 | #17 | Exceptional 4.7% |
| Immigrants | Venezuela | 99.9 /100 | #18 | Exceptional 4.7% |
| Scottish | 99.9 /100 | #19 | Exceptional 4.7% |
| Carpatho Rusyns | 99.9 /100 | #20 | Exceptional 4.7% |
| Welsh | 99.9 /100 | #21 | Exceptional 4.7% |
| Thais | 99.9 /100 | #22 | Exceptional 4.7% |
| British | 99.9 /100 | #23 | Exceptional 4.7% |
| Venezuelans | 99.9 /100 | #24 | Exceptional 4.7% |
| Latvians | 99.9 /100 | #25 | Exceptional 4.7% |
| Bulgarians | 99.9 /100 | #26 | Exceptional 4.7% |