Tsimshian vs Immigrants from Cameroon Family Poverty
COMPARE
Tsimshian
Immigrants from Cameroon
Family Poverty
Family Poverty Comparison
Tsimshian
Immigrants from Cameroon
8.8%
FAMILY POVERTY
69.3/ 100
METRIC RATING
157th/ 347
METRIC RANK
9.0%
FAMILY POVERTY
47.1/ 100
METRIC RATING
178th/ 347
METRIC RANK
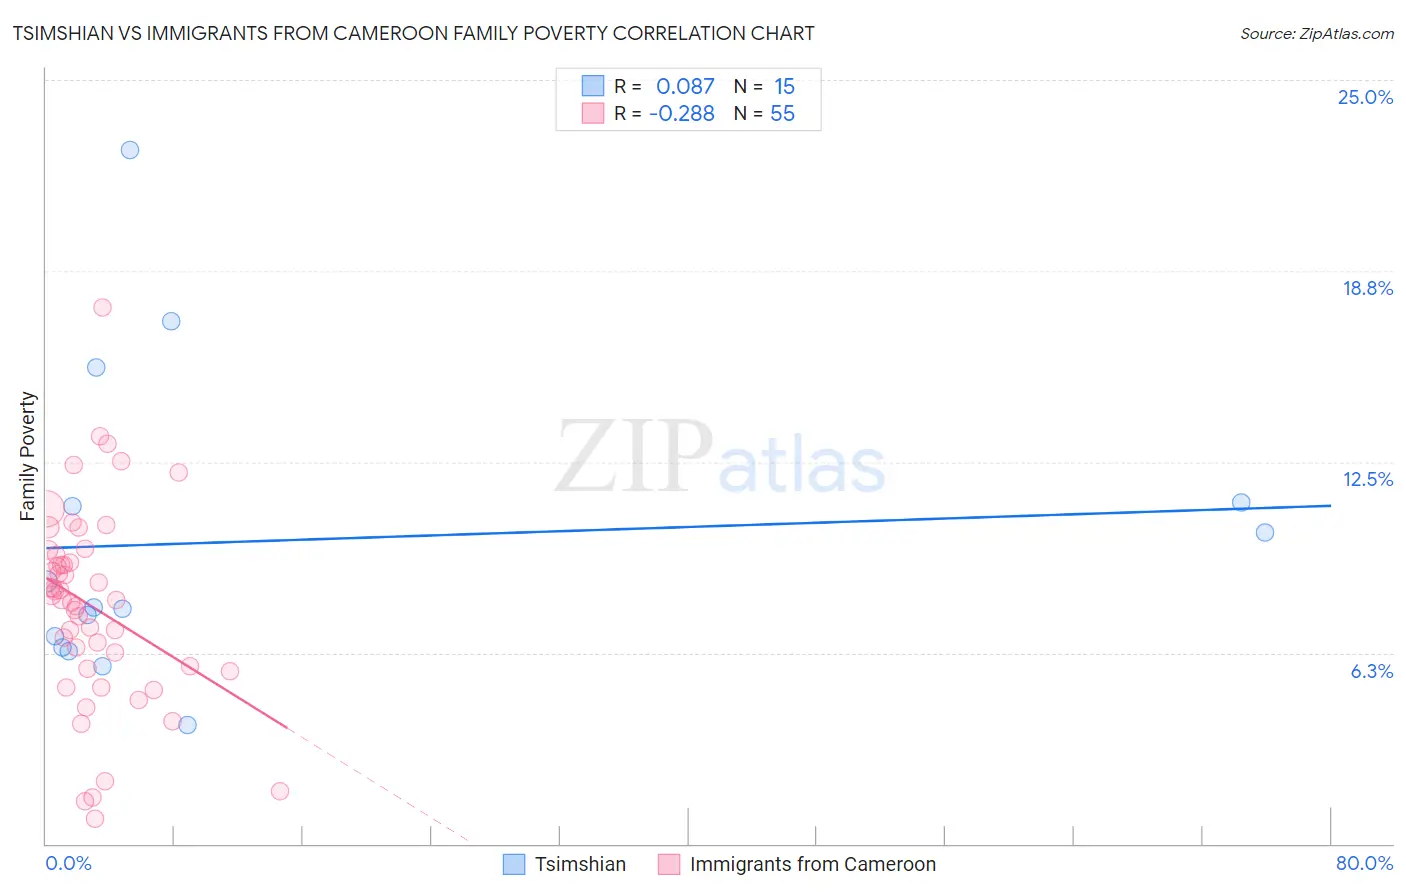
Tsimshian vs Immigrants from Cameroon Family Poverty Correlation Chart
The statistical analysis conducted on geographies consisting of 15,624,889 people shows a slight positive correlation between the proportion of Tsimshian and poverty level among families in the United States with a correlation coefficient (R) of 0.087 and weighted average of 8.8%. Similarly, the statistical analysis conducted on geographies consisting of 130,510,031 people shows a weak negative correlation between the proportion of Immigrants from Cameroon and poverty level among families in the United States with a correlation coefficient (R) of -0.288 and weighted average of 9.0%, a difference of 3.1%.
Family Poverty Correlation Summary
| Measurement | Tsimshian | Immigrants from Cameroon |
| Minimum | 3.9% | 0.83% |
| Maximum | 22.7% | 17.5% |
| Range | 18.9% | 16.7% |
| Mean | 9.9% | 7.8% |
| Median | 7.7% | 8.0% |
| Interquartile 25% (IQ1) | 6.4% | 5.7% |
| Interquartile 75% (IQ3) | 11.2% | 9.5% |
| Interquartile Range (IQR) | 4.7% | 3.7% |
| Standard Deviation (Sample) | 5.0% | 3.2% |
| Standard Deviation (Population) | 4.9% | 3.2% |
Similar Demographics by Family Poverty
Demographics Similar to Tsimshian by Family Poverty
In terms of family poverty, the demographic groups most similar to Tsimshian are White/Caucasian (8.8%, a difference of 0.040%), Peruvian (8.8%, a difference of 0.20%), Immigrants from Oceania (8.7%, a difference of 0.30%), Hungarian (8.8%, a difference of 0.34%), and Immigrants from Northern Africa (8.8%, a difference of 0.38%).
| Demographics | Rating | Rank | Family Poverty |
| Syrians | 80.3 /100 | #150 | Excellent 8.6% |
| Brazilians | 80.1 /100 | #151 | Excellent 8.6% |
| Samoans | 79.8 /100 | #152 | Good 8.6% |
| Immigrants | Spain | 79.1 /100 | #153 | Good 8.6% |
| Immigrants | Vietnam | 75.4 /100 | #154 | Good 8.7% |
| Immigrants | Kuwait | 73.6 /100 | #155 | Good 8.7% |
| Immigrants | Oceania | 71.2 /100 | #156 | Good 8.7% |
| Tsimshian | 69.3 /100 | #157 | Good 8.8% |
| Whites/Caucasians | 69.1 /100 | #158 | Good 8.8% |
| Peruvians | 68.0 /100 | #159 | Good 8.8% |
| Hungarians | 67.2 /100 | #160 | Good 8.8% |
| Immigrants | Northern Africa | 66.9 /100 | #161 | Good 8.8% |
| Ethiopians | 66.3 /100 | #162 | Good 8.8% |
| Pennsylvania Germans | 66.0 /100 | #163 | Good 8.8% |
| Celtics | 64.9 /100 | #164 | Good 8.8% |
Demographics Similar to Immigrants from Cameroon by Family Poverty
In terms of family poverty, the demographic groups most similar to Immigrants from Cameroon are Hawaiian (9.0%, a difference of 0.010%), Immigrants from Syria (9.0%, a difference of 0.040%), Costa Rican (9.0%, a difference of 0.28%), Immigrants from Iraq (9.1%, a difference of 0.36%), and Immigrants from Albania (9.0%, a difference of 0.37%).
| Demographics | Rating | Rank | Family Poverty |
| Lebanese | 57.6 /100 | #171 | Average 8.9% |
| Immigrants | Peru | 57.5 /100 | #172 | Average 8.9% |
| Immigrants | Fiji | 56.4 /100 | #173 | Average 8.9% |
| Immigrants | Albania | 50.0 /100 | #174 | Average 9.0% |
| Costa Ricans | 49.3 /100 | #175 | Average 9.0% |
| Immigrants | Syria | 47.5 /100 | #176 | Average 9.0% |
| Hawaiians | 47.2 /100 | #177 | Average 9.0% |
| Immigrants | Cameroon | 47.1 /100 | #178 | Average 9.0% |
| Immigrants | Iraq | 44.4 /100 | #179 | Average 9.1% |
| Immigrants | Uganda | 43.4 /100 | #180 | Average 9.1% |
| Hmong | 40.2 /100 | #181 | Average 9.1% |
| Immigrants | Morocco | 40.2 /100 | #182 | Average 9.1% |
| Uruguayans | 39.2 /100 | #183 | Fair 9.1% |
| South American Indians | 38.7 /100 | #184 | Fair 9.1% |
| Immigrants | Saudi Arabia | 38.6 /100 | #185 | Fair 9.1% |