Tsimshian vs Immigrants from Laos Unemployment
COMPARE
Tsimshian
Immigrants from Laos
Unemployment
Unemployment Comparison
Tsimshian
Immigrants from Laos
7.2%
UNEMPLOYMENT
0.0/ 100
METRIC RATING
328th/ 347
METRIC RANK
5.3%
UNEMPLOYMENT
30.9/ 100
METRIC RATING
194th/ 347
METRIC RANK
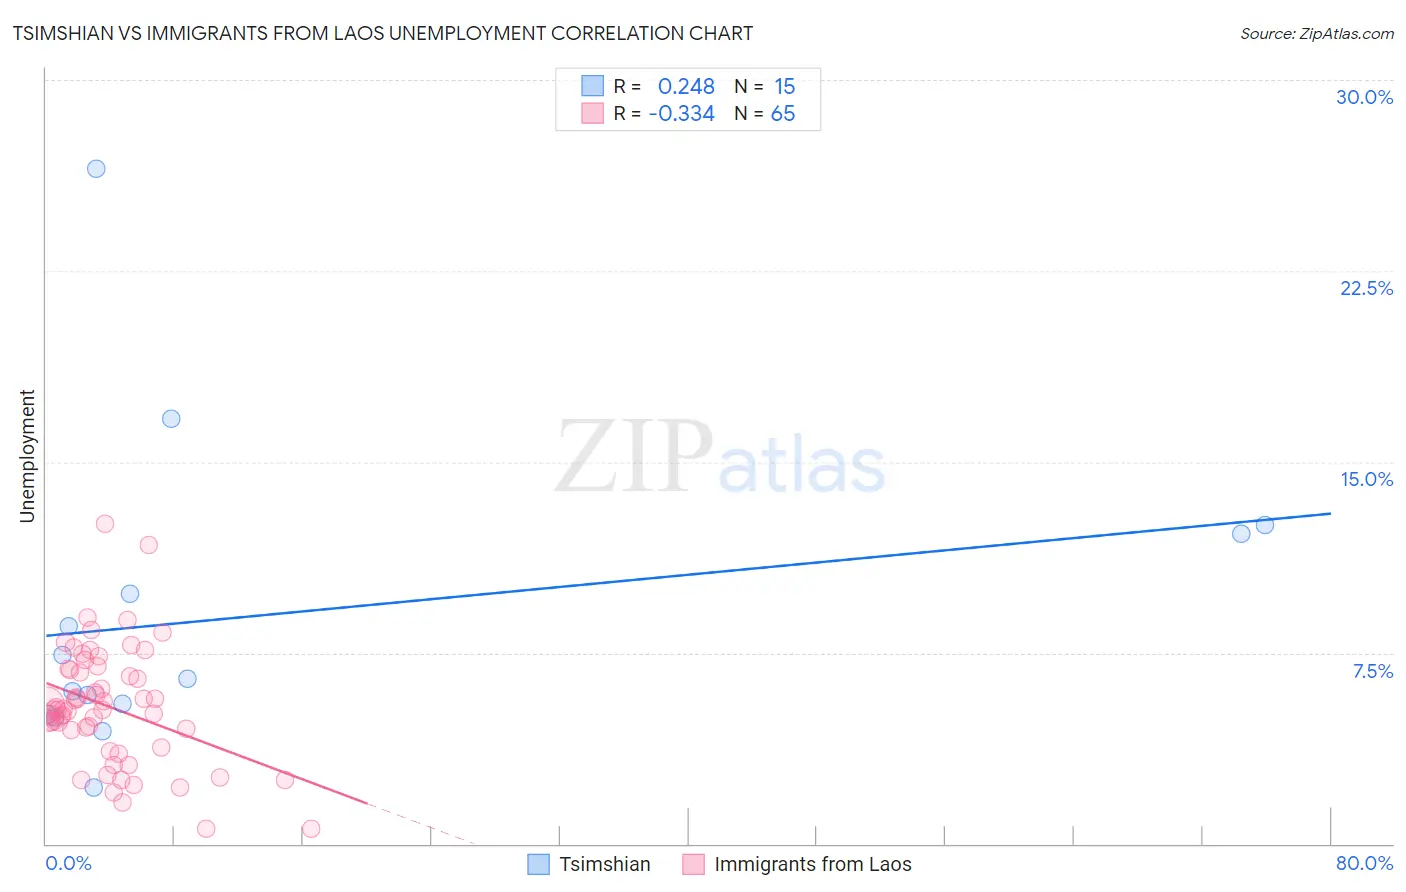
Tsimshian vs Immigrants from Laos Unemployment Correlation Chart
The statistical analysis conducted on geographies consisting of 15,625,029 people shows a weak positive correlation between the proportion of Tsimshian and unemployment in the United States with a correlation coefficient (R) of 0.248 and weighted average of 7.2%. Similarly, the statistical analysis conducted on geographies consisting of 201,374,148 people shows a mild negative correlation between the proportion of Immigrants from Laos and unemployment in the United States with a correlation coefficient (R) of -0.334 and weighted average of 5.3%, a difference of 35.6%.
Unemployment Correlation Summary
| Measurement | Tsimshian | Immigrants from Laos |
| Minimum | 2.2% | 0.60% |
| Maximum | 26.5% | 12.6% |
| Range | 24.3% | 12.0% |
| Mean | 8.9% | 5.4% |
| Median | 6.5% | 5.3% |
| Interquartile 25% (IQ1) | 5.1% | 4.1% |
| Interquartile 75% (IQ3) | 12.2% | 6.9% |
| Interquartile Range (IQR) | 7.1% | 2.7% |
| Standard Deviation (Sample) | 6.1% | 2.3% |
| Standard Deviation (Population) | 5.9% | 2.3% |
Similar Demographics by Unemployment
Demographics Similar to Tsimshian by Unemployment
In terms of unemployment, the demographic groups most similar to Tsimshian are Alaska Native (7.2%, a difference of 0.31%), Pueblo (7.2%, a difference of 0.91%), Paiute (7.1%, a difference of 1.4%), Yakama (7.3%, a difference of 1.6%), and Dominican (7.4%, a difference of 1.9%).
| Demographics | Rating | Rank | Unemployment |
| Immigrants | Guyana | 0.0 /100 | #321 | Tragic 6.9% |
| Guyanese | 0.0 /100 | #322 | Tragic 6.9% |
| Immigrants | Grenada | 0.0 /100 | #323 | Tragic 6.9% |
| Immigrants | Armenia | 0.0 /100 | #324 | Tragic 7.0% |
| Natives/Alaskans | 0.0 /100 | #325 | Tragic 7.0% |
| Paiute | 0.0 /100 | #326 | Tragic 7.1% |
| Pueblo | 0.0 /100 | #327 | Tragic 7.2% |
| Tsimshian | 0.0 /100 | #328 | Tragic 7.2% |
| Alaska Natives | 0.0 /100 | #329 | Tragic 7.2% |
| Yakama | 0.0 /100 | #330 | Tragic 7.3% |
| Dominicans | 0.0 /100 | #331 | Tragic 7.4% |
| Sioux | 0.0 /100 | #332 | Tragic 7.4% |
| Immigrants | Dominican Republic | 0.0 /100 | #333 | Tragic 7.4% |
| Apache | 0.0 /100 | #334 | Tragic 7.4% |
| Alaskan Athabascans | 0.0 /100 | #335 | Tragic 7.7% |
Demographics Similar to Immigrants from Laos by Unemployment
In terms of unemployment, the demographic groups most similar to Immigrants from Laos are Immigrants from Southern Europe (5.3%, a difference of 0.0%), Peruvian (5.3%, a difference of 0.080%), Immigrants from Uruguay (5.3%, a difference of 0.080%), Immigrants from Israel (5.3%, a difference of 0.17%), and Immigrants from Afghanistan (5.3%, a difference of 0.17%).
| Demographics | Rating | Rank | Unemployment |
| Costa Ricans | 37.4 /100 | #187 | Fair 5.3% |
| Alsatians | 37.0 /100 | #188 | Fair 5.3% |
| Immigrants | Belarus | 35.6 /100 | #189 | Fair 5.3% |
| Arabs | 35.3 /100 | #190 | Fair 5.3% |
| Somalis | 34.0 /100 | #191 | Fair 5.3% |
| South Americans | 33.9 /100 | #192 | Fair 5.3% |
| Immigrants | Somalia | 33.8 /100 | #193 | Fair 5.3% |
| Immigrants | Laos | 30.9 /100 | #194 | Fair 5.3% |
| Immigrants | Southern Europe | 30.9 /100 | #195 | Fair 5.3% |
| Peruvians | 29.9 /100 | #196 | Fair 5.3% |
| Immigrants | Uruguay | 29.8 /100 | #197 | Fair 5.3% |
| Immigrants | Israel | 28.6 /100 | #198 | Fair 5.3% |
| Immigrants | Afghanistan | 28.6 /100 | #199 | Fair 5.3% |
| Koreans | 27.4 /100 | #200 | Fair 5.3% |
| Immigrants | South Eastern Asia | 27.0 /100 | #201 | Fair 5.3% |