Immigrants from Panama vs Immigrants from Cameroon Unemployment
COMPARE
Immigrants from Panama
Immigrants from Cameroon
Unemployment
Unemployment Comparison
Immigrants from Panama
Immigrants from Cameroon
5.5%
UNEMPLOYMENT
3.4/ 100
METRIC RATING
235th/ 347
METRIC RANK
5.6%
UNEMPLOYMENT
1.0/ 100
METRIC RATING
247th/ 347
METRIC RANK
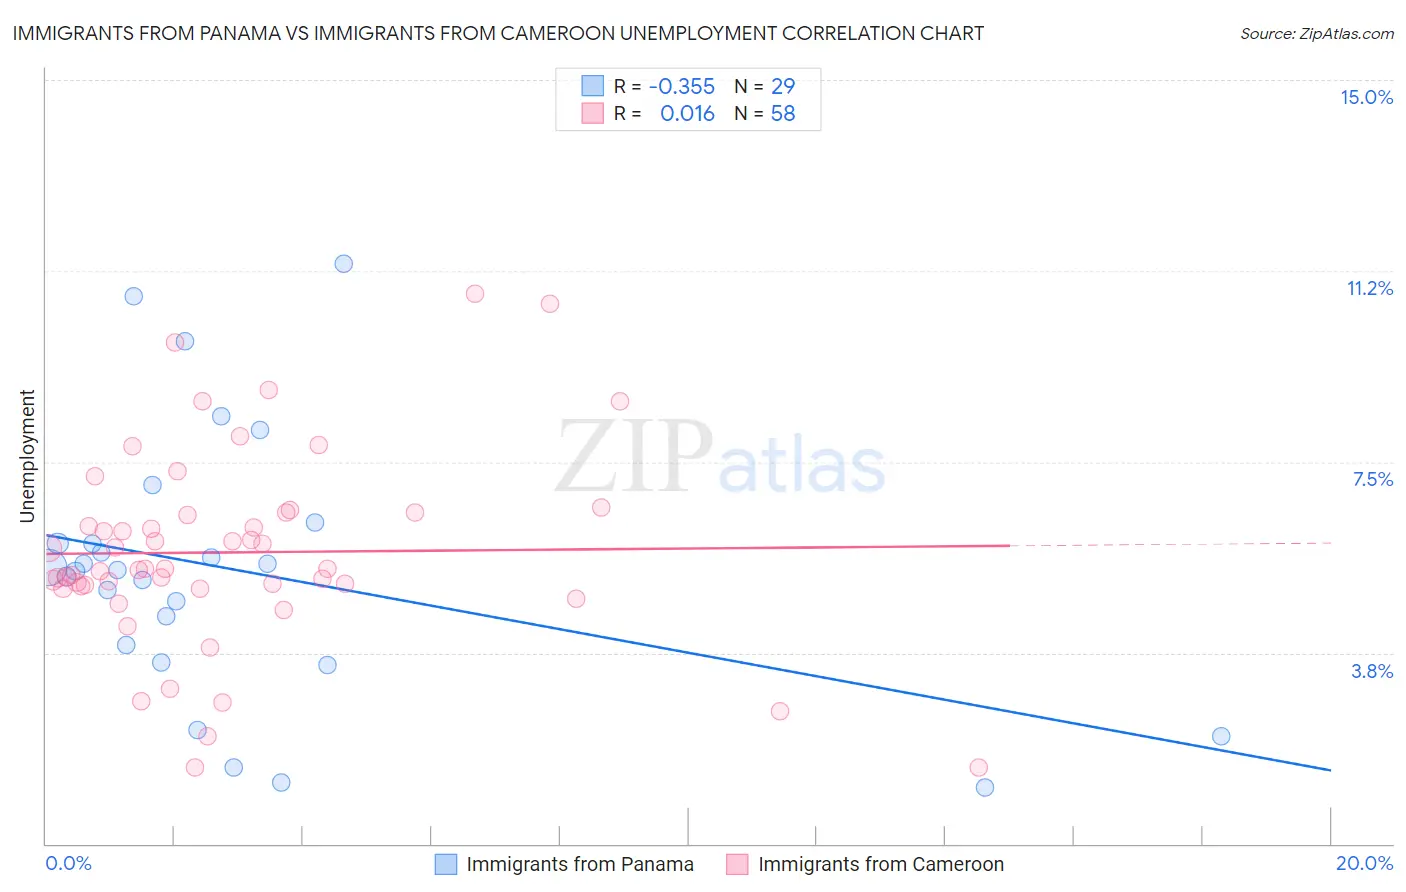
Immigrants from Panama vs Immigrants from Cameroon Unemployment Correlation Chart
The statistical analysis conducted on geographies consisting of 221,138,228 people shows a mild negative correlation between the proportion of Immigrants from Panama and unemployment in the United States with a correlation coefficient (R) of -0.355 and weighted average of 5.5%. Similarly, the statistical analysis conducted on geographies consisting of 130,734,727 people shows no correlation between the proportion of Immigrants from Cameroon and unemployment in the United States with a correlation coefficient (R) of 0.016 and weighted average of 5.6%, a difference of 1.8%.
Unemployment Correlation Summary
| Measurement | Immigrants from Panama | Immigrants from Cameroon |
| Minimum | 1.1% | 1.5% |
| Maximum | 11.4% | 10.8% |
| Range | 10.3% | 9.3% |
| Mean | 5.4% | 5.7% |
| Median | 5.4% | 5.4% |
| Interquartile 25% (IQ1) | 3.7% | 5.1% |
| Interquartile 75% (IQ3) | 6.1% | 6.5% |
| Interquartile Range (IQR) | 2.4% | 1.4% |
| Standard Deviation (Sample) | 2.6% | 1.9% |
| Standard Deviation (Population) | 2.5% | 1.9% |
Demographics Similar to Immigrants from Panama and Immigrants from Cameroon by Unemployment
In terms of unemployment, the demographic groups most similar to Immigrants from Panama are Immigrants from Cambodia (5.5%, a difference of 0.030%), Moroccan (5.5%, a difference of 0.090%), Immigrants from Western Asia (5.5%, a difference of 0.30%), Immigrants (5.5%, a difference of 0.39%), and Cree (5.6%, a difference of 0.40%). Similarly, the demographic groups most similar to Immigrants from Cameroon are Liberian (5.6%, a difference of 0.13%), Bermudan (5.6%, a difference of 0.15%), French American Indian (5.6%, a difference of 0.19%), Dutch West Indian (5.6%, a difference of 0.21%), and Marshallese (5.6%, a difference of 0.36%).
| Demographics | Rating | Rank | Unemployment |
| Immigrants | Africa | 4.9 /100 | #231 | Tragic 5.5% |
| Comanche | 4.9 /100 | #232 | Tragic 5.5% |
| Immigrants | Syria | 4.8 /100 | #233 | Tragic 5.5% |
| Panamanians | 4.7 /100 | #234 | Tragic 5.5% |
| Immigrants | Panama | 3.4 /100 | #235 | Tragic 5.5% |
| Immigrants | Cambodia | 3.3 /100 | #236 | Tragic 5.5% |
| Moroccans | 3.2 /100 | #237 | Tragic 5.5% |
| Immigrants | Western Asia | 2.8 /100 | #238 | Tragic 5.5% |
| Immigrants | Immigrants | 2.6 /100 | #239 | Tragic 5.5% |
| Cree | 2.6 /100 | #240 | Tragic 5.6% |
| Tlingit-Haida | 2.0 /100 | #241 | Tragic 5.6% |
| Spanish Americans | 2.0 /100 | #242 | Tragic 5.6% |
| Marshallese | 1.3 /100 | #243 | Tragic 5.6% |
| Dutch West Indians | 1.2 /100 | #244 | Tragic 5.6% |
| French American Indians | 1.2 /100 | #245 | Tragic 5.6% |
| Bermudans | 1.1 /100 | #246 | Tragic 5.6% |
| Immigrants | Cameroon | 1.0 /100 | #247 | Tragic 5.6% |
| Liberians | 0.9 /100 | #248 | Tragic 5.6% |
| Cajuns | 0.8 /100 | #249 | Tragic 5.6% |
| Japanese | 0.8 /100 | #250 | Tragic 5.6% |
| Kiowa | 0.6 /100 | #251 | Tragic 5.7% |