Navajo vs Immigrants from Netherlands Male Unemployment
COMPARE
Navajo
Immigrants from Netherlands
Male Unemployment
Male Unemployment Comparison
Navajo
Immigrants from Netherlands
9.8%
MALE UNEMPLOYMENT
0.0/ 100
METRIC RATING
341st/ 347
METRIC RANK
5.0%
MALE UNEMPLOYMENT
98.3/ 100
METRIC RATING
59th/ 347
METRIC RANK
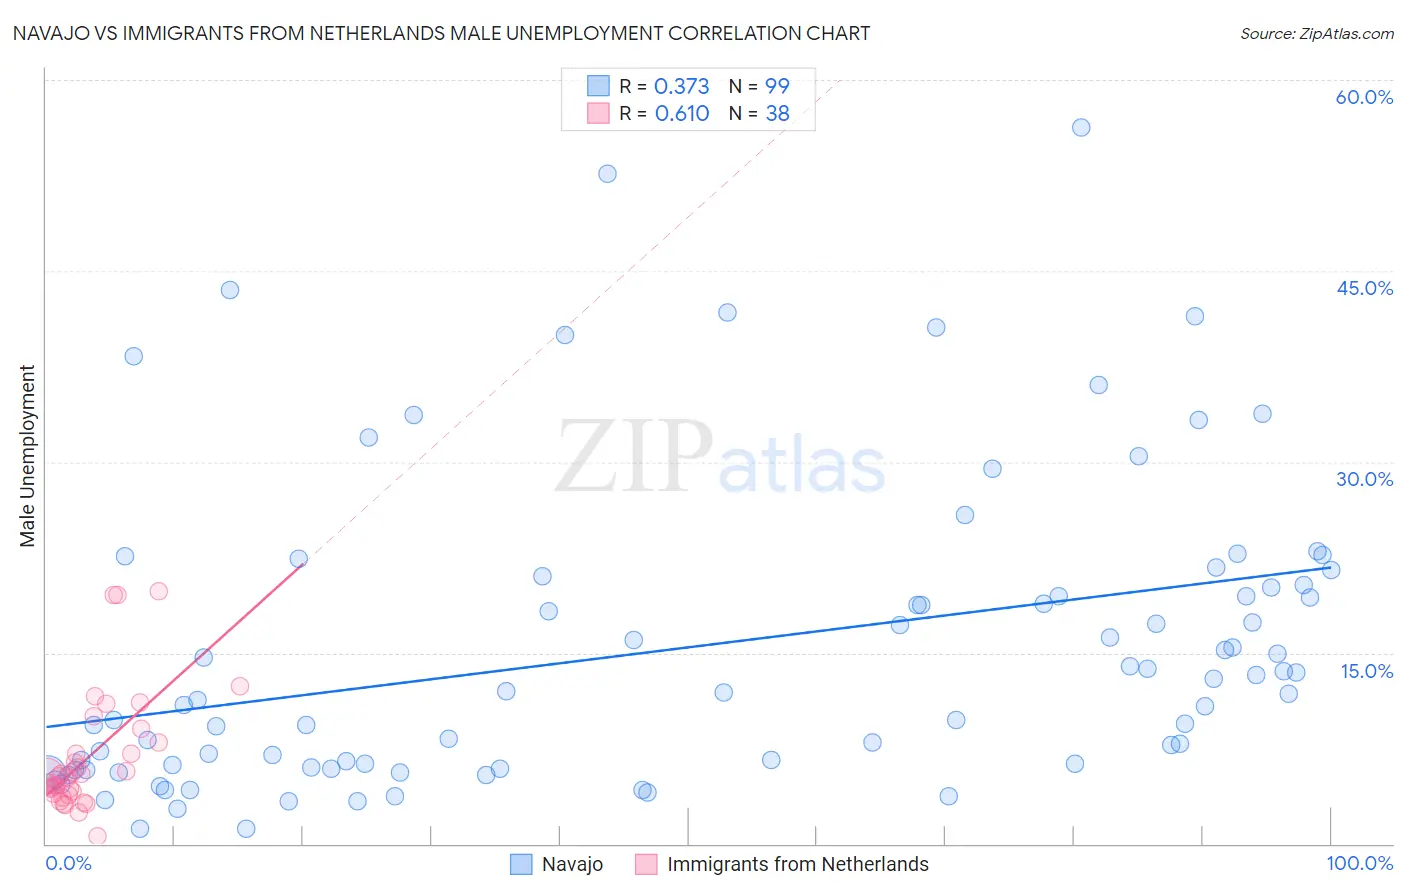
Navajo vs Immigrants from Netherlands Male Unemployment Correlation Chart
The statistical analysis conducted on geographies consisting of 223,979,709 people shows a mild positive correlation between the proportion of Navajo and unemployment rate among males in the United States with a correlation coefficient (R) of 0.373 and weighted average of 9.8%. Similarly, the statistical analysis conducted on geographies consisting of 237,368,894 people shows a significant positive correlation between the proportion of Immigrants from Netherlands and unemployment rate among males in the United States with a correlation coefficient (R) of 0.610 and weighted average of 5.0%, a difference of 97.5%.
Male Unemployment Correlation Summary
| Measurement | Navajo | Immigrants from Netherlands |
| Minimum | 1.2% | 0.60% |
| Maximum | 56.3% | 19.8% |
| Range | 55.1% | 19.2% |
| Mean | 15.4% | 6.8% |
| Median | 11.9% | 5.3% |
| Interquartile 25% (IQ1) | 6.0% | 4.0% |
| Interquartile 75% (IQ3) | 20.4% | 8.0% |
| Interquartile Range (IQR) | 14.4% | 4.0% |
| Standard Deviation (Sample) | 12.0% | 4.7% |
| Standard Deviation (Population) | 11.9% | 4.6% |
Similar Demographics by Male Unemployment
Demographics Similar to Navajo by Male Unemployment
In terms of male unemployment, the demographic groups most similar to Navajo are Alaskan Athabascan (9.8%, a difference of 0.28%), Cheyenne (9.8%, a difference of 0.36%), Tohono O'odham (10.2%, a difference of 3.4%), Crow (10.6%, a difference of 7.9%), and Hopi (10.8%, a difference of 9.7%).
| Demographics | Rating | Rank | Male Unemployment |
| Sioux | 0.0 /100 | #333 | Tragic 8.4% |
| Tsimshian | 0.0 /100 | #334 | Tragic 8.5% |
| Pueblo | 0.0 /100 | #335 | Tragic 8.5% |
| Yuman | 0.0 /100 | #336 | Tragic 8.6% |
| Puerto Ricans | 0.0 /100 | #337 | Tragic 8.6% |
| Apache | 0.0 /100 | #338 | Tragic 8.6% |
| Cheyenne | 0.0 /100 | #339 | Tragic 9.8% |
| Alaskan Athabascans | 0.0 /100 | #340 | Tragic 9.8% |
| Navajo | 0.0 /100 | #341 | Tragic 9.8% |
| Tohono O'odham | 0.0 /100 | #342 | Tragic 10.2% |
| Crow | 0.0 /100 | #343 | Tragic 10.6% |
| Hopi | 0.0 /100 | #344 | Tragic 10.8% |
| Arapaho | 0.0 /100 | #345 | Tragic 11.0% |
| Inupiat | 0.0 /100 | #346 | Tragic 12.1% |
| Yup'ik | 0.0 /100 | #347 | Tragic 16.4% |
Demographics Similar to Immigrants from Netherlands by Male Unemployment
In terms of male unemployment, the demographic groups most similar to Immigrants from Netherlands are Turkish (5.0%, a difference of 0.14%), Lithuanian (5.0%, a difference of 0.14%), Immigrants from Argentina (5.0%, a difference of 0.18%), Cambodian (5.0%, a difference of 0.26%), and Immigrants from Bulgaria (5.0%, a difference of 0.37%).
| Demographics | Rating | Rank | Male Unemployment |
| Irish | 98.8 /100 | #52 | Exceptional 5.0% |
| Jordanians | 98.8 /100 | #53 | Exceptional 5.0% |
| Yugoslavians | 98.7 /100 | #54 | Exceptional 5.0% |
| Czechoslovakians | 98.7 /100 | #55 | Exceptional 5.0% |
| Immigrants | Bulgaria | 98.7 /100 | #56 | Exceptional 5.0% |
| Turks | 98.5 /100 | #57 | Exceptional 5.0% |
| Lithuanians | 98.5 /100 | #58 | Exceptional 5.0% |
| Immigrants | Netherlands | 98.3 /100 | #59 | Exceptional 5.0% |
| Immigrants | Argentina | 98.1 /100 | #60 | Exceptional 5.0% |
| Cambodians | 98.1 /100 | #61 | Exceptional 5.0% |
| Basques | 97.9 /100 | #62 | Exceptional 5.0% |
| Eastern Europeans | 97.9 /100 | #63 | Exceptional 5.0% |
| Celtics | 97.8 /100 | #64 | Exceptional 5.0% |
| Icelanders | 97.6 /100 | #65 | Exceptional 5.0% |
| Finns | 97.5 /100 | #66 | Exceptional 5.0% |