Lumbee vs Immigrants from Brazil Female Unemployment
COMPARE
Lumbee
Immigrants from Brazil
Female Unemployment
Female Unemployment Comparison
Lumbee
Immigrants from Brazil
5.9%
FEMALE UNEMPLOYMENT
0.0/ 100
METRIC RATING
272nd/ 347
METRIC RANK
5.4%
FEMALE UNEMPLOYMENT
18.8/ 100
METRIC RATING
206th/ 347
METRIC RANK
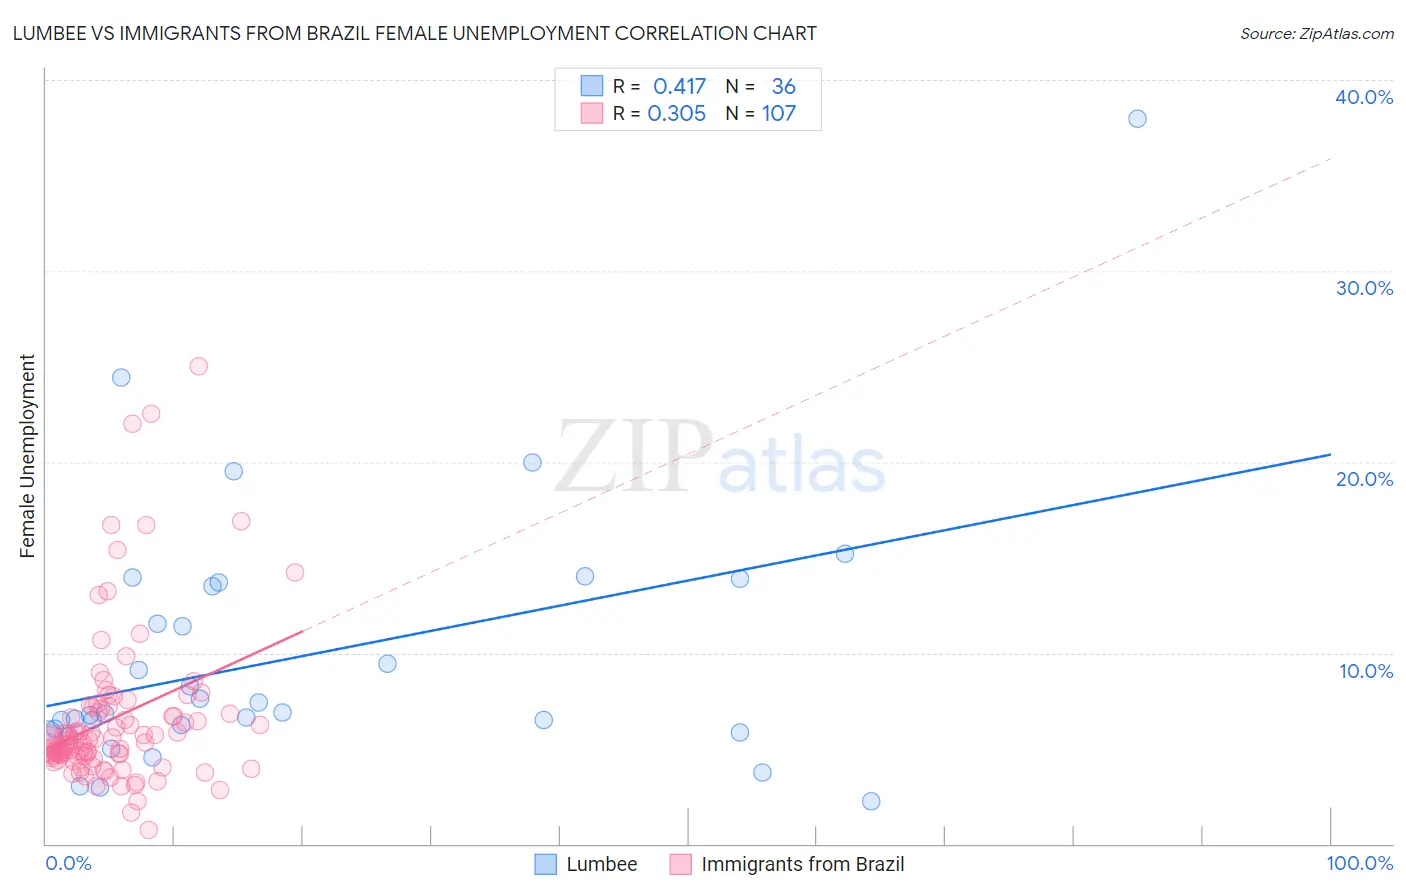
Lumbee vs Immigrants from Brazil Female Unemployment Correlation Chart
The statistical analysis conducted on geographies consisting of 92,134,947 people shows a moderate positive correlation between the proportion of Lumbee and unemploymnet rate among females in the United States with a correlation coefficient (R) of 0.417 and weighted average of 5.9%. Similarly, the statistical analysis conducted on geographies consisting of 341,906,511 people shows a mild positive correlation between the proportion of Immigrants from Brazil and unemploymnet rate among females in the United States with a correlation coefficient (R) of 0.305 and weighted average of 5.4%, a difference of 10.6%.
Female Unemployment Correlation Summary
| Measurement | Lumbee | Immigrants from Brazil |
| Minimum | 2.2% | 0.70% |
| Maximum | 38.0% | 25.0% |
| Range | 35.8% | 24.3% |
| Mean | 9.8% | 6.5% |
| Median | 6.9% | 5.4% |
| Interquartile 25% (IQ1) | 5.9% | 4.6% |
| Interquartile 75% (IQ3) | 13.6% | 7.1% |
| Interquartile Range (IQR) | 7.7% | 2.5% |
| Standard Deviation (Sample) | 7.0% | 4.1% |
| Standard Deviation (Population) | 6.9% | 4.1% |
Similar Demographics by Female Unemployment
Demographics Similar to Lumbee by Female Unemployment
In terms of female unemployment, the demographic groups most similar to Lumbee are Ghanaian (5.9%, a difference of 0.010%), African (5.9%, a difference of 0.090%), Central American (5.9%, a difference of 0.19%), Immigrants from Honduras (5.9%, a difference of 0.29%), and Senegalese (6.0%, a difference of 0.58%).
| Demographics | Rating | Rank | Female Unemployment |
| Blackfeet | 0.0 /100 | #265 | Tragic 5.9% |
| Cape Verdeans | 0.0 /100 | #266 | Tragic 5.9% |
| Nepalese | 0.0 /100 | #267 | Tragic 5.9% |
| Hondurans | 0.0 /100 | #268 | Tragic 5.9% |
| Immigrants | Western Africa | 0.0 /100 | #269 | Tragic 5.9% |
| Immigrants | Honduras | 0.0 /100 | #270 | Tragic 5.9% |
| Central Americans | 0.0 /100 | #271 | Tragic 5.9% |
| Lumbee | 0.0 /100 | #272 | Tragic 5.9% |
| Ghanaians | 0.0 /100 | #273 | Tragic 5.9% |
| Africans | 0.0 /100 | #274 | Tragic 5.9% |
| Senegalese | 0.0 /100 | #275 | Tragic 6.0% |
| Bahamians | 0.0 /100 | #276 | Tragic 6.0% |
| Immigrants | Ghana | 0.0 /100 | #277 | Tragic 6.0% |
| Yaqui | 0.0 /100 | #278 | Tragic 6.0% |
| Armenians | 0.0 /100 | #279 | Tragic 6.0% |
Demographics Similar to Immigrants from Brazil by Female Unemployment
In terms of female unemployment, the demographic groups most similar to Immigrants from Brazil are Immigrants from Afghanistan (5.4%, a difference of 0.020%), Immigrants from Israel (5.4%, a difference of 0.090%), Immigrants from South Eastern Asia (5.4%, a difference of 0.15%), Immigrants from Middle Africa (5.4%, a difference of 0.19%), and Iroquois (5.4%, a difference of 0.19%).
| Demographics | Rating | Rank | Female Unemployment |
| Hawaiians | 22.2 /100 | #199 | Fair 5.4% |
| Soviet Union | 21.7 /100 | #200 | Fair 5.4% |
| Immigrants | Middle Africa | 20.8 /100 | #201 | Fair 5.4% |
| Iroquois | 20.8 /100 | #202 | Fair 5.4% |
| Immigrants | South Eastern Asia | 20.3 /100 | #203 | Fair 5.4% |
| Immigrants | Israel | 19.7 /100 | #204 | Poor 5.4% |
| Immigrants | Afghanistan | 18.9 /100 | #205 | Poor 5.4% |
| Immigrants | Brazil | 18.8 /100 | #206 | Poor 5.4% |
| Creek | 15.4 /100 | #207 | Poor 5.4% |
| Immigrants | Costa Rica | 13.7 /100 | #208 | Poor 5.4% |
| Koreans | 13.4 /100 | #209 | Poor 5.4% |
| Choctaw | 12.3 /100 | #210 | Poor 5.4% |
| Ottawa | 11.6 /100 | #211 | Poor 5.4% |
| Uruguayans | 11.4 /100 | #212 | Poor 5.4% |
| Samoans | 10.6 /100 | #213 | Poor 5.4% |