Malaysian vs Immigrants from Brazil Female Unemployment
COMPARE
Malaysian
Immigrants from Brazil
Female Unemployment
Female Unemployment Comparison
Malaysians
Immigrants from Brazil
5.3%
FEMALE UNEMPLOYMENT
40.1/ 100
METRIC RATING
185th/ 347
METRIC RANK
5.4%
FEMALE UNEMPLOYMENT
18.8/ 100
METRIC RATING
206th/ 347
METRIC RANK
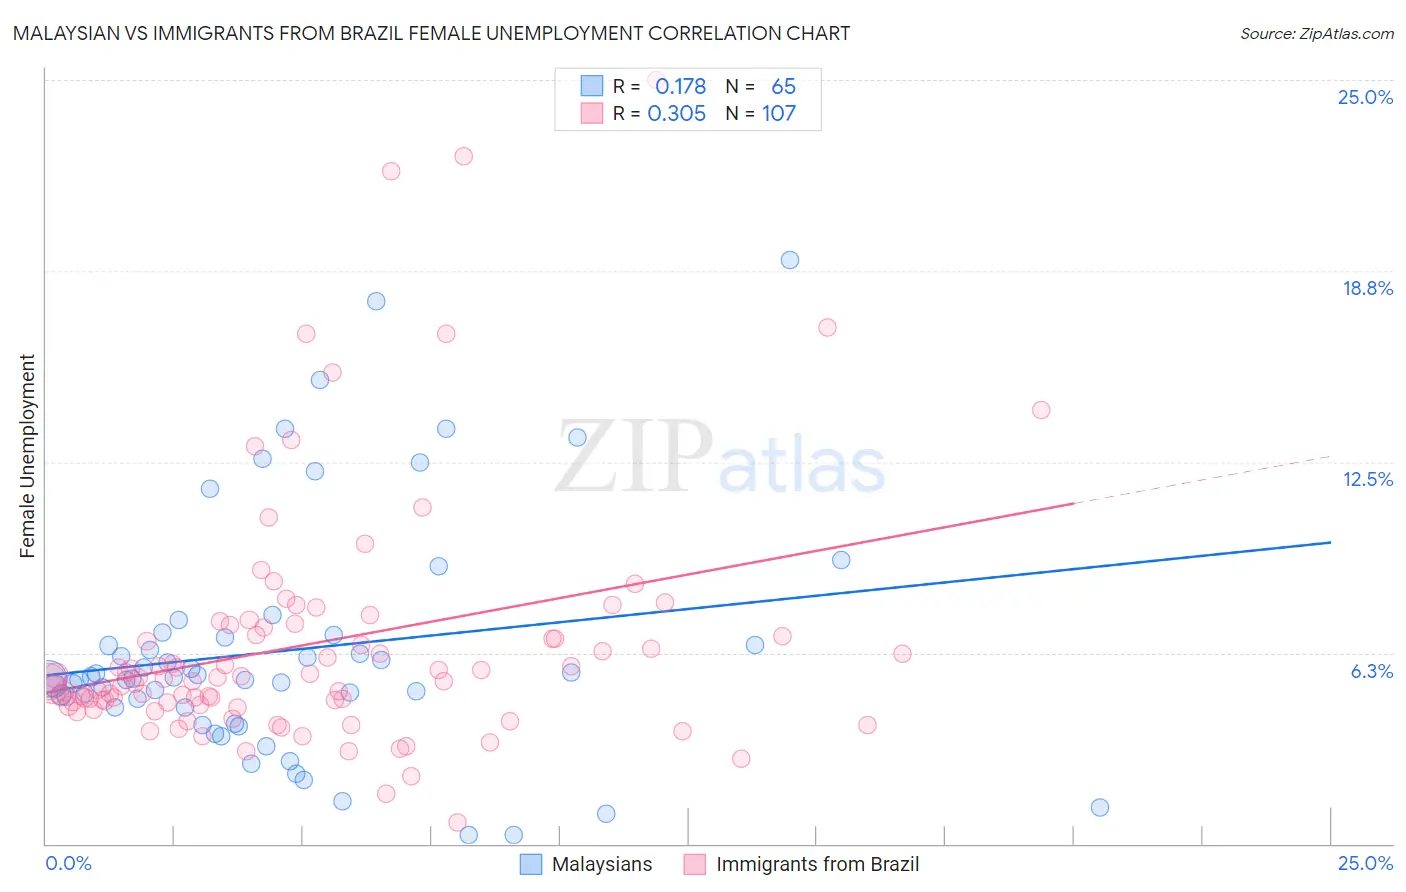
Malaysian vs Immigrants from Brazil Female Unemployment Correlation Chart
The statistical analysis conducted on geographies consisting of 225,706,419 people shows a poor positive correlation between the proportion of Malaysians and unemploymnet rate among females in the United States with a correlation coefficient (R) of 0.178 and weighted average of 5.3%. Similarly, the statistical analysis conducted on geographies consisting of 341,906,511 people shows a mild positive correlation between the proportion of Immigrants from Brazil and unemploymnet rate among females in the United States with a correlation coefficient (R) of 0.305 and weighted average of 5.4%, a difference of 1.6%.
Female Unemployment Correlation Summary
| Measurement | Malaysian | Immigrants from Brazil |
| Minimum | 0.30% | 0.70% |
| Maximum | 19.1% | 25.0% |
| Range | 18.8% | 24.3% |
| Mean | 6.3% | 6.5% |
| Median | 5.4% | 5.4% |
| Interquartile 25% (IQ1) | 4.5% | 4.6% |
| Interquartile 75% (IQ3) | 6.8% | 7.1% |
| Interquartile Range (IQR) | 2.3% | 2.5% |
| Standard Deviation (Sample) | 3.9% | 4.1% |
| Standard Deviation (Population) | 3.9% | 4.1% |
Similar Demographics by Female Unemployment
Demographics Similar to Malaysians by Female Unemployment
In terms of female unemployment, the demographic groups most similar to Malaysians are Immigrants from Ukraine (5.3%, a difference of 0.010%), Immigrants from Indonesia (5.3%, a difference of 0.040%), Immigrants from Belarus (5.3%, a difference of 0.040%), Taiwanese (5.3%, a difference of 0.16%), and Nonimmigrants (5.3%, a difference of 0.16%).
| Demographics | Rating | Rank | Female Unemployment |
| Immigrants | Southern Europe | 46.2 /100 | #178 | Average 5.3% |
| Laotians | 45.1 /100 | #179 | Average 5.3% |
| Immigrants | Congo | 43.1 /100 | #180 | Average 5.3% |
| Taiwanese | 42.7 /100 | #181 | Average 5.3% |
| Immigrants | Nonimmigrants | 42.6 /100 | #182 | Average 5.3% |
| Immigrants | Indonesia | 40.7 /100 | #183 | Average 5.3% |
| Immigrants | Ukraine | 40.1 /100 | #184 | Average 5.3% |
| Malaysians | 40.1 /100 | #185 | Average 5.3% |
| Immigrants | Belarus | 39.4 /100 | #186 | Fair 5.3% |
| Immigrants | Albania | 35.4 /100 | #187 | Fair 5.3% |
| Afghans | 33.9 /100 | #188 | Fair 5.3% |
| Costa Ricans | 33.8 /100 | #189 | Fair 5.3% |
| Ugandans | 31.2 /100 | #190 | Fair 5.3% |
| Cherokee | 30.8 /100 | #191 | Fair 5.3% |
| Portuguese | 28.6 /100 | #192 | Fair 5.3% |
Demographics Similar to Immigrants from Brazil by Female Unemployment
In terms of female unemployment, the demographic groups most similar to Immigrants from Brazil are Immigrants from Afghanistan (5.4%, a difference of 0.020%), Immigrants from Israel (5.4%, a difference of 0.090%), Immigrants from South Eastern Asia (5.4%, a difference of 0.15%), Immigrants from Middle Africa (5.4%, a difference of 0.19%), and Iroquois (5.4%, a difference of 0.19%).
| Demographics | Rating | Rank | Female Unemployment |
| Hawaiians | 22.2 /100 | #199 | Fair 5.4% |
| Soviet Union | 21.7 /100 | #200 | Fair 5.4% |
| Immigrants | Middle Africa | 20.8 /100 | #201 | Fair 5.4% |
| Iroquois | 20.8 /100 | #202 | Fair 5.4% |
| Immigrants | South Eastern Asia | 20.3 /100 | #203 | Fair 5.4% |
| Immigrants | Israel | 19.7 /100 | #204 | Poor 5.4% |
| Immigrants | Afghanistan | 18.9 /100 | #205 | Poor 5.4% |
| Immigrants | Brazil | 18.8 /100 | #206 | Poor 5.4% |
| Creek | 15.4 /100 | #207 | Poor 5.4% |
| Immigrants | Costa Rica | 13.7 /100 | #208 | Poor 5.4% |
| Koreans | 13.4 /100 | #209 | Poor 5.4% |
| Choctaw | 12.3 /100 | #210 | Poor 5.4% |
| Ottawa | 11.6 /100 | #211 | Poor 5.4% |
| Uruguayans | 11.4 /100 | #212 | Poor 5.4% |
| Samoans | 10.6 /100 | #213 | Poor 5.4% |