Lumbee vs Immigrants from Uruguay Female Unemployment
COMPARE
Lumbee
Immigrants from Uruguay
Female Unemployment
Female Unemployment Comparison
Lumbee
Immigrants from Uruguay
5.9%
FEMALE UNEMPLOYMENT
0.0/ 100
METRIC RATING
272nd/ 347
METRIC RANK
5.5%
FEMALE UNEMPLOYMENT
4.7/ 100
METRIC RATING
230th/ 347
METRIC RANK
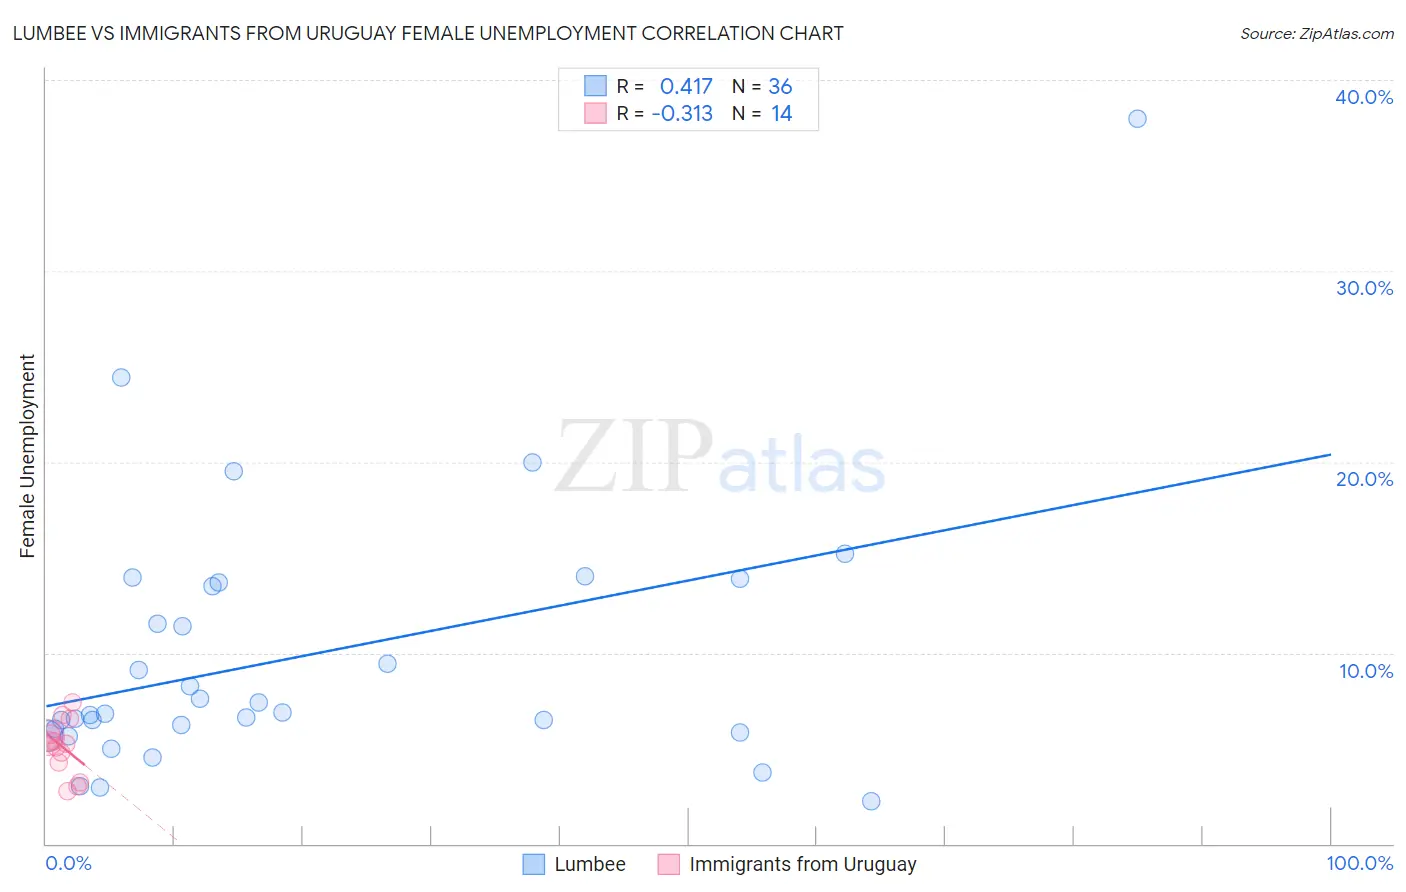
Lumbee vs Immigrants from Uruguay Female Unemployment Correlation Chart
The statistical analysis conducted on geographies consisting of 92,134,947 people shows a moderate positive correlation between the proportion of Lumbee and unemploymnet rate among females in the United States with a correlation coefficient (R) of 0.417 and weighted average of 5.9%. Similarly, the statistical analysis conducted on geographies consisting of 133,202,140 people shows a mild negative correlation between the proportion of Immigrants from Uruguay and unemploymnet rate among females in the United States with a correlation coefficient (R) of -0.313 and weighted average of 5.5%, a difference of 8.2%.
Female Unemployment Correlation Summary
| Measurement | Lumbee | Immigrants from Uruguay |
| Minimum | 2.2% | 2.8% |
| Maximum | 38.0% | 7.4% |
| Range | 35.8% | 4.6% |
| Mean | 9.8% | 5.1% |
| Median | 6.9% | 5.3% |
| Interquartile 25% (IQ1) | 5.9% | 4.2% |
| Interquartile 75% (IQ3) | 13.6% | 5.7% |
| Interquartile Range (IQR) | 7.7% | 1.5% |
| Standard Deviation (Sample) | 7.0% | 1.4% |
| Standard Deviation (Population) | 6.9% | 1.3% |
Similar Demographics by Female Unemployment
Demographics Similar to Lumbee by Female Unemployment
In terms of female unemployment, the demographic groups most similar to Lumbee are Ghanaian (5.9%, a difference of 0.010%), African (5.9%, a difference of 0.090%), Central American (5.9%, a difference of 0.19%), Immigrants from Honduras (5.9%, a difference of 0.29%), and Senegalese (6.0%, a difference of 0.58%).
| Demographics | Rating | Rank | Female Unemployment |
| Blackfeet | 0.0 /100 | #265 | Tragic 5.9% |
| Cape Verdeans | 0.0 /100 | #266 | Tragic 5.9% |
| Nepalese | 0.0 /100 | #267 | Tragic 5.9% |
| Hondurans | 0.0 /100 | #268 | Tragic 5.9% |
| Immigrants | Western Africa | 0.0 /100 | #269 | Tragic 5.9% |
| Immigrants | Honduras | 0.0 /100 | #270 | Tragic 5.9% |
| Central Americans | 0.0 /100 | #271 | Tragic 5.9% |
| Lumbee | 0.0 /100 | #272 | Tragic 5.9% |
| Ghanaians | 0.0 /100 | #273 | Tragic 5.9% |
| Africans | 0.0 /100 | #274 | Tragic 5.9% |
| Senegalese | 0.0 /100 | #275 | Tragic 6.0% |
| Bahamians | 0.0 /100 | #276 | Tragic 6.0% |
| Immigrants | Ghana | 0.0 /100 | #277 | Tragic 6.0% |
| Yaqui | 0.0 /100 | #278 | Tragic 6.0% |
| Armenians | 0.0 /100 | #279 | Tragic 6.0% |
Demographics Similar to Immigrants from Uruguay by Female Unemployment
In terms of female unemployment, the demographic groups most similar to Immigrants from Uruguay are Panamanian (5.5%, a difference of 0.010%), Israeli (5.5%, a difference of 0.020%), Immigrants from Philippines (5.5%, a difference of 0.18%), Immigrants from Iraq (5.5%, a difference of 0.27%), and Liberian (5.5%, a difference of 0.28%).
| Demographics | Rating | Rank | Female Unemployment |
| Delaware | 7.2 /100 | #223 | Tragic 5.5% |
| Iraqis | 7.1 /100 | #224 | Tragic 5.5% |
| French American Indians | 6.1 /100 | #225 | Tragic 5.5% |
| Immigrants | Peru | 5.9 /100 | #226 | Tragic 5.5% |
| Immigrants | Philippines | 5.3 /100 | #227 | Tragic 5.5% |
| Israelis | 4.8 /100 | #228 | Tragic 5.5% |
| Panamanians | 4.7 /100 | #229 | Tragic 5.5% |
| Immigrants | Uruguay | 4.7 /100 | #230 | Tragic 5.5% |
| Immigrants | Iraq | 3.9 /100 | #231 | Tragic 5.5% |
| Liberians | 3.9 /100 | #232 | Tragic 5.5% |
| Moroccans | 3.4 /100 | #233 | Tragic 5.5% |
| Immigrants | Lebanon | 3.3 /100 | #234 | Tragic 5.5% |
| Immigrants | Iran | 3.3 /100 | #235 | Tragic 5.5% |
| Immigrants | Cambodia | 3.3 /100 | #236 | Tragic 5.5% |
| Immigrants | Panama | 3.2 /100 | #237 | Tragic 5.5% |