U.S. Virgin Islander vs Immigrants from Brazil Female Unemployment
COMPARE
U.S. Virgin Islander
Immigrants from Brazil
Female Unemployment
Female Unemployment Comparison
U.S. Virgin Islanders
Immigrants from Brazil
6.2%
FEMALE UNEMPLOYMENT
0.0/ 100
METRIC RATING
302nd/ 347
METRIC RANK
5.4%
FEMALE UNEMPLOYMENT
18.8/ 100
METRIC RATING
206th/ 347
METRIC RANK
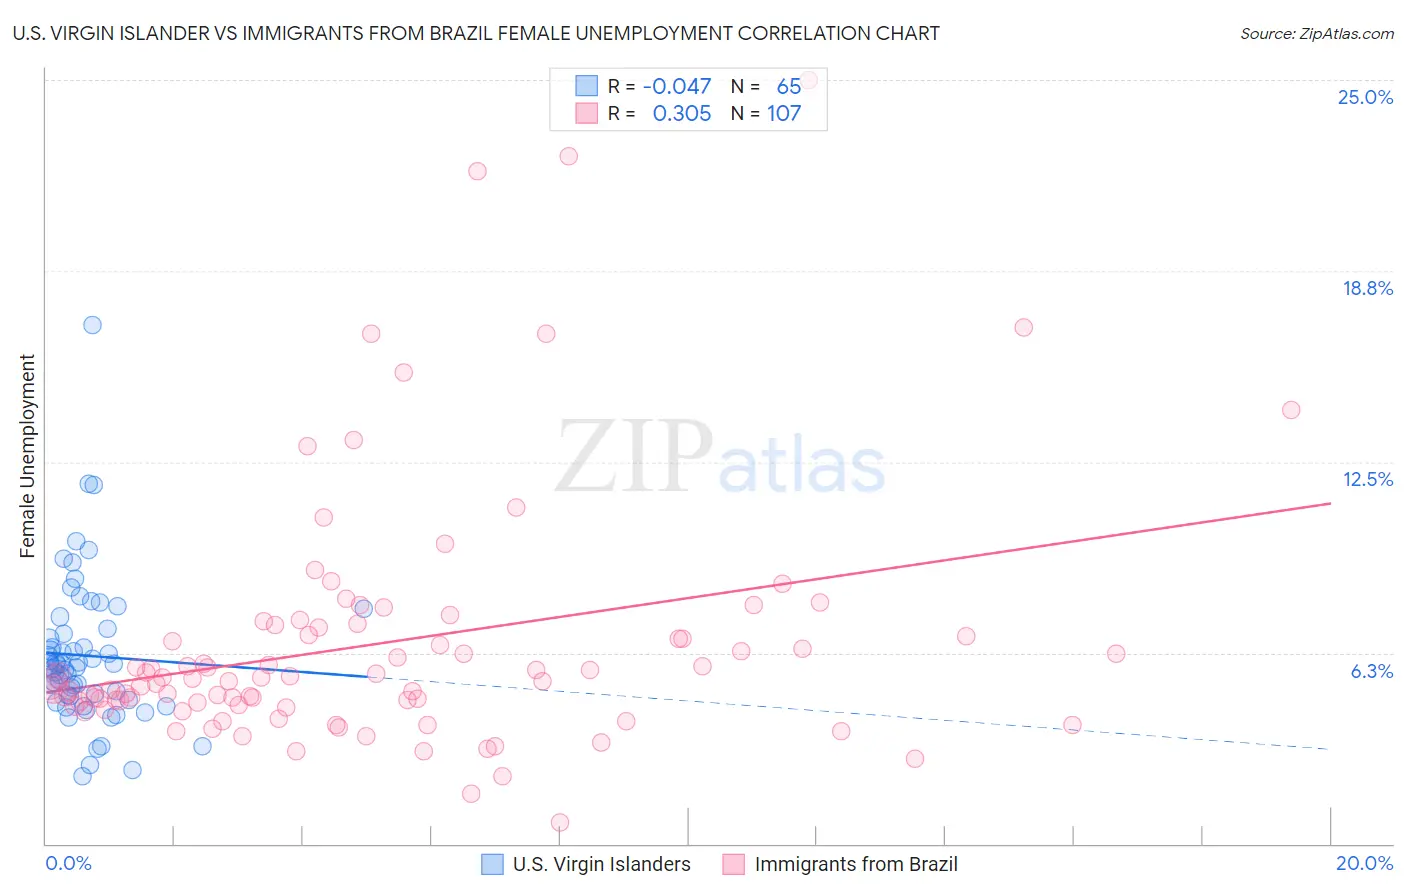
U.S. Virgin Islander vs Immigrants from Brazil Female Unemployment Correlation Chart
The statistical analysis conducted on geographies consisting of 87,490,240 people shows no correlation between the proportion of U.S. Virgin Islanders and unemploymnet rate among females in the United States with a correlation coefficient (R) of -0.047 and weighted average of 6.2%. Similarly, the statistical analysis conducted on geographies consisting of 341,906,511 people shows a mild positive correlation between the proportion of Immigrants from Brazil and unemploymnet rate among females in the United States with a correlation coefficient (R) of 0.305 and weighted average of 5.4%, a difference of 14.8%.
Female Unemployment Correlation Summary
| Measurement | U.S. Virgin Islander | Immigrants from Brazil |
| Minimum | 2.2% | 0.70% |
| Maximum | 17.0% | 25.0% |
| Range | 14.8% | 24.3% |
| Mean | 6.2% | 6.5% |
| Median | 5.9% | 5.4% |
| Interquartile 25% (IQ1) | 4.8% | 4.6% |
| Interquartile 75% (IQ3) | 7.0% | 7.1% |
| Interquartile Range (IQR) | 2.2% | 2.5% |
| Standard Deviation (Sample) | 2.4% | 4.1% |
| Standard Deviation (Population) | 2.4% | 4.1% |
Similar Demographics by Female Unemployment
Demographics Similar to U.S. Virgin Islanders by Female Unemployment
In terms of female unemployment, the demographic groups most similar to U.S. Virgin Islanders are Immigrants from Barbados (6.2%, a difference of 0.15%), Barbadian (6.2%, a difference of 0.34%), Immigrants from Haiti (6.1%, a difference of 0.60%), Ute (6.1%, a difference of 0.65%), and Immigrants from Jamaica (6.2%, a difference of 0.71%).
| Demographics | Rating | Rank | Female Unemployment |
| Immigrants | Latin America | 0.0 /100 | #295 | Tragic 6.1% |
| Alaskan Athabascans | 0.0 /100 | #296 | Tragic 6.1% |
| West Indians | 0.0 /100 | #297 | Tragic 6.1% |
| Jamaicans | 0.0 /100 | #298 | Tragic 6.1% |
| Ute | 0.0 /100 | #299 | Tragic 6.1% |
| Immigrants | Haiti | 0.0 /100 | #300 | Tragic 6.1% |
| Immigrants | Barbados | 0.0 /100 | #301 | Tragic 6.2% |
| U.S. Virgin Islanders | 0.0 /100 | #302 | Tragic 6.2% |
| Barbadians | 0.0 /100 | #303 | Tragic 6.2% |
| Immigrants | Jamaica | 0.0 /100 | #304 | Tragic 6.2% |
| Spanish American Indians | 0.0 /100 | #305 | Tragic 6.2% |
| Immigrants | Central America | 0.0 /100 | #306 | Tragic 6.2% |
| Shoshone | 0.0 /100 | #307 | Tragic 6.2% |
| Hispanics or Latinos | 0.0 /100 | #308 | Tragic 6.2% |
| Ecuadorians | 0.0 /100 | #309 | Tragic 6.3% |
Demographics Similar to Immigrants from Brazil by Female Unemployment
In terms of female unemployment, the demographic groups most similar to Immigrants from Brazil are Immigrants from Afghanistan (5.4%, a difference of 0.020%), Immigrants from Israel (5.4%, a difference of 0.090%), Immigrants from South Eastern Asia (5.4%, a difference of 0.15%), Immigrants from Middle Africa (5.4%, a difference of 0.19%), and Iroquois (5.4%, a difference of 0.19%).
| Demographics | Rating | Rank | Female Unemployment |
| Hawaiians | 22.2 /100 | #199 | Fair 5.4% |
| Soviet Union | 21.7 /100 | #200 | Fair 5.4% |
| Immigrants | Middle Africa | 20.8 /100 | #201 | Fair 5.4% |
| Iroquois | 20.8 /100 | #202 | Fair 5.4% |
| Immigrants | South Eastern Asia | 20.3 /100 | #203 | Fair 5.4% |
| Immigrants | Israel | 19.7 /100 | #204 | Poor 5.4% |
| Immigrants | Afghanistan | 18.9 /100 | #205 | Poor 5.4% |
| Immigrants | Brazil | 18.8 /100 | #206 | Poor 5.4% |
| Creek | 15.4 /100 | #207 | Poor 5.4% |
| Immigrants | Costa Rica | 13.7 /100 | #208 | Poor 5.4% |
| Koreans | 13.4 /100 | #209 | Poor 5.4% |
| Choctaw | 12.3 /100 | #210 | Poor 5.4% |
| Ottawa | 11.6 /100 | #211 | Poor 5.4% |
| Uruguayans | 11.4 /100 | #212 | Poor 5.4% |
| Samoans | 10.6 /100 | #213 | Poor 5.4% |