Lumbee vs Immigrants from Congo Female Unemployment
COMPARE
Lumbee
Immigrants from Congo
Female Unemployment
Female Unemployment Comparison
Lumbee
Immigrants from Congo
5.9%
FEMALE UNEMPLOYMENT
0.0/ 100
METRIC RATING
272nd/ 347
METRIC RANK
5.3%
FEMALE UNEMPLOYMENT
43.1/ 100
METRIC RATING
180th/ 347
METRIC RANK
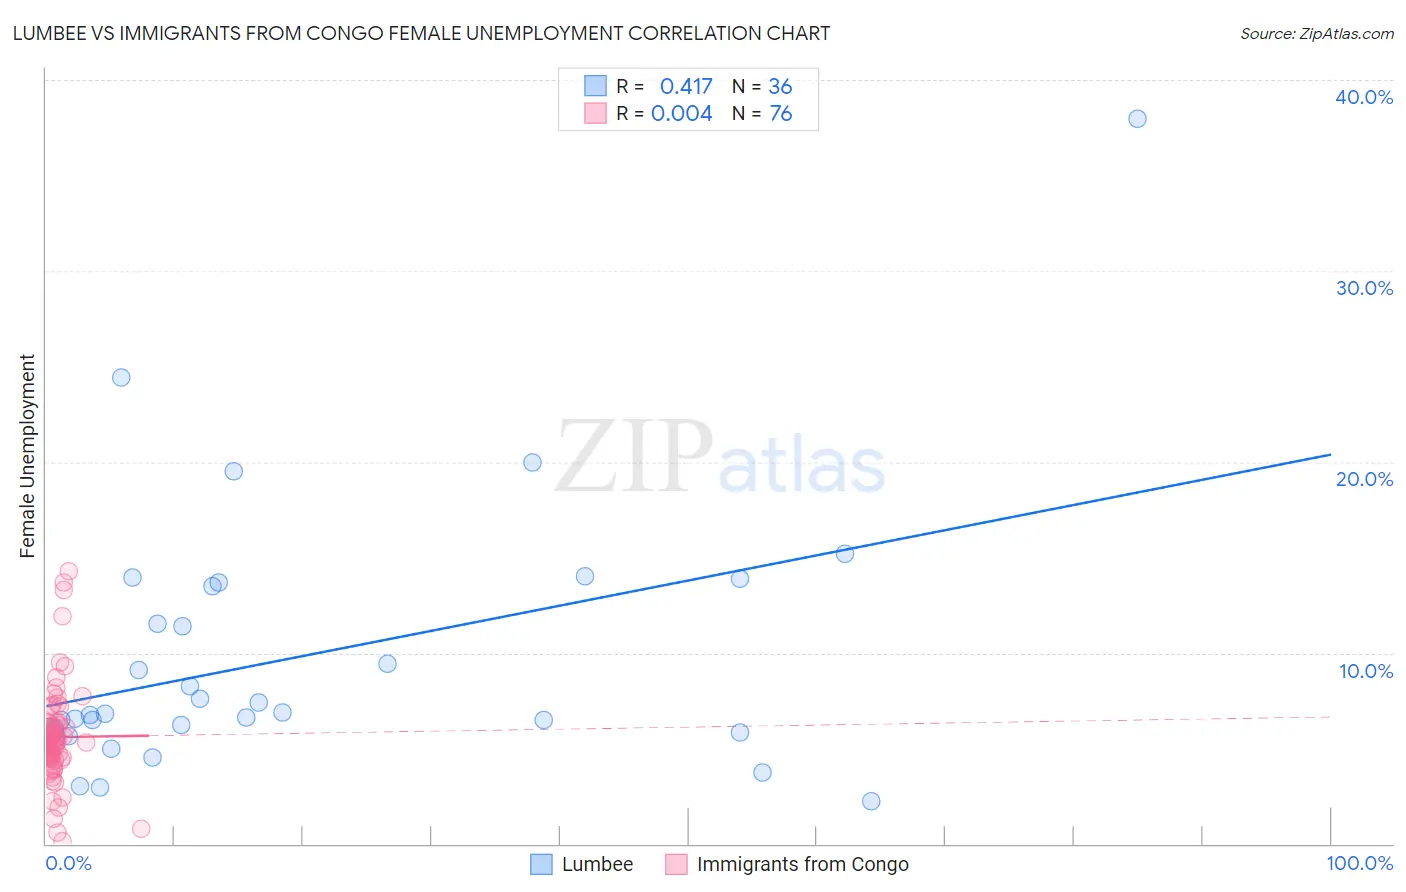
Lumbee vs Immigrants from Congo Female Unemployment Correlation Chart
The statistical analysis conducted on geographies consisting of 92,134,947 people shows a moderate positive correlation between the proportion of Lumbee and unemploymnet rate among females in the United States with a correlation coefficient (R) of 0.417 and weighted average of 5.9%. Similarly, the statistical analysis conducted on geographies consisting of 92,074,429 people shows no correlation between the proportion of Immigrants from Congo and unemploymnet rate among females in the United States with a correlation coefficient (R) of 0.004 and weighted average of 5.3%, a difference of 12.6%.
Female Unemployment Correlation Summary
| Measurement | Lumbee | Immigrants from Congo |
| Minimum | 2.2% | 0.10% |
| Maximum | 38.0% | 14.3% |
| Range | 35.8% | 14.2% |
| Mean | 9.8% | 5.6% |
| Median | 6.9% | 5.3% |
| Interquartile 25% (IQ1) | 5.9% | 4.5% |
| Interquartile 75% (IQ3) | 13.6% | 6.2% |
| Interquartile Range (IQR) | 7.7% | 1.7% |
| Standard Deviation (Sample) | 7.0% | 2.6% |
| Standard Deviation (Population) | 6.9% | 2.5% |
Similar Demographics by Female Unemployment
Demographics Similar to Lumbee by Female Unemployment
In terms of female unemployment, the demographic groups most similar to Lumbee are Ghanaian (5.9%, a difference of 0.010%), African (5.9%, a difference of 0.090%), Central American (5.9%, a difference of 0.19%), Immigrants from Honduras (5.9%, a difference of 0.29%), and Senegalese (6.0%, a difference of 0.58%).
| Demographics | Rating | Rank | Female Unemployment |
| Blackfeet | 0.0 /100 | #265 | Tragic 5.9% |
| Cape Verdeans | 0.0 /100 | #266 | Tragic 5.9% |
| Nepalese | 0.0 /100 | #267 | Tragic 5.9% |
| Hondurans | 0.0 /100 | #268 | Tragic 5.9% |
| Immigrants | Western Africa | 0.0 /100 | #269 | Tragic 5.9% |
| Immigrants | Honduras | 0.0 /100 | #270 | Tragic 5.9% |
| Central Americans | 0.0 /100 | #271 | Tragic 5.9% |
| Lumbee | 0.0 /100 | #272 | Tragic 5.9% |
| Ghanaians | 0.0 /100 | #273 | Tragic 5.9% |
| Africans | 0.0 /100 | #274 | Tragic 5.9% |
| Senegalese | 0.0 /100 | #275 | Tragic 6.0% |
| Bahamians | 0.0 /100 | #276 | Tragic 6.0% |
| Immigrants | Ghana | 0.0 /100 | #277 | Tragic 6.0% |
| Yaqui | 0.0 /100 | #278 | Tragic 6.0% |
| Armenians | 0.0 /100 | #279 | Tragic 6.0% |
Demographics Similar to Immigrants from Congo by Female Unemployment
In terms of female unemployment, the demographic groups most similar to Immigrants from Congo are Taiwanese (5.3%, a difference of 0.020%), Nonimmigrants (5.3%, a difference of 0.030%), Laotian (5.3%, a difference of 0.12%), Immigrants from Indonesia (5.3%, a difference of 0.15%), and Immigrants from Ukraine (5.3%, a difference of 0.18%).
| Demographics | Rating | Rank | Female Unemployment |
| Iranians | 50.4 /100 | #173 | Average 5.3% |
| Immigrants | Poland | 50.0 /100 | #174 | Average 5.3% |
| Immigrants | Laos | 47.5 /100 | #175 | Average 5.3% |
| Immigrants | Vietnam | 47.5 /100 | #176 | Average 5.3% |
| Immigrants | Morocco | 47.4 /100 | #177 | Average 5.3% |
| Immigrants | Southern Europe | 46.2 /100 | #178 | Average 5.3% |
| Laotians | 45.1 /100 | #179 | Average 5.3% |
| Immigrants | Congo | 43.1 /100 | #180 | Average 5.3% |
| Taiwanese | 42.7 /100 | #181 | Average 5.3% |
| Immigrants | Nonimmigrants | 42.6 /100 | #182 | Average 5.3% |
| Immigrants | Indonesia | 40.7 /100 | #183 | Average 5.3% |
| Immigrants | Ukraine | 40.1 /100 | #184 | Average 5.3% |
| Malaysians | 40.1 /100 | #185 | Average 5.3% |
| Immigrants | Belarus | 39.4 /100 | #186 | Fair 5.3% |
| Immigrants | Albania | 35.4 /100 | #187 | Fair 5.3% |