Hawaiian vs Immigrants from Brazil Female Unemployment
COMPARE
Hawaiian
Immigrants from Brazil
Female Unemployment
Female Unemployment Comparison
Hawaiians
Immigrants from Brazil
5.4%
FEMALE UNEMPLOYMENT
22.2/ 100
METRIC RATING
199th/ 347
METRIC RANK
5.4%
FEMALE UNEMPLOYMENT
18.8/ 100
METRIC RATING
206th/ 347
METRIC RANK
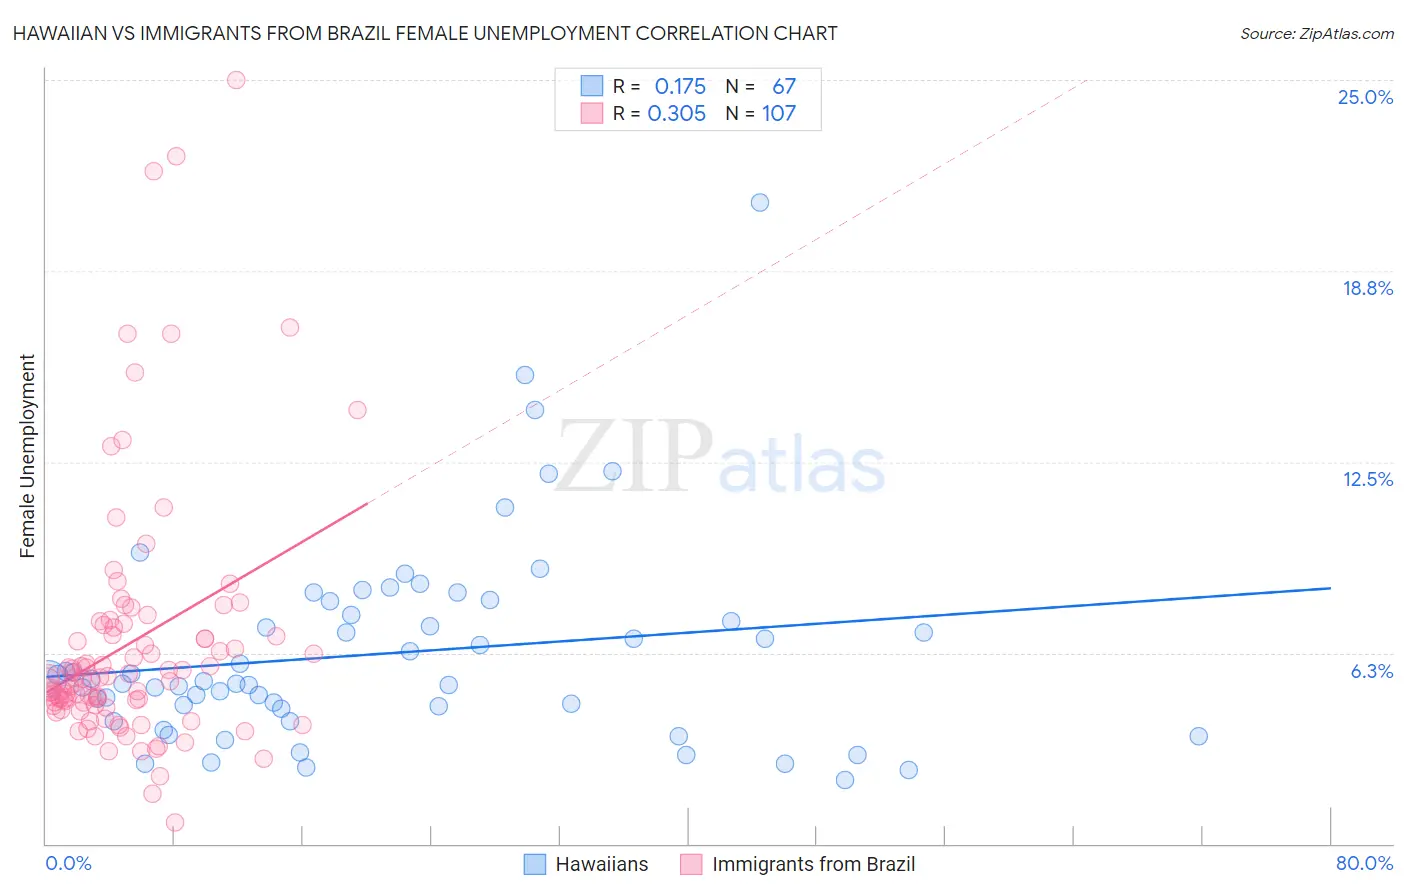
Hawaiian vs Immigrants from Brazil Female Unemployment Correlation Chart
The statistical analysis conducted on geographies consisting of 326,158,717 people shows a poor positive correlation between the proportion of Hawaiians and unemploymnet rate among females in the United States with a correlation coefficient (R) of 0.175 and weighted average of 5.4%. Similarly, the statistical analysis conducted on geographies consisting of 341,906,511 people shows a mild positive correlation between the proportion of Immigrants from Brazil and unemploymnet rate among females in the United States with a correlation coefficient (R) of 0.305 and weighted average of 5.4%, a difference of 0.31%.
Female Unemployment Correlation Summary
| Measurement | Hawaiian | Immigrants from Brazil |
| Minimum | 2.1% | 0.70% |
| Maximum | 21.0% | 25.0% |
| Range | 18.9% | 24.3% |
| Mean | 6.2% | 6.5% |
| Median | 5.3% | 5.4% |
| Interquartile 25% (IQ1) | 4.4% | 4.6% |
| Interquartile 75% (IQ3) | 7.5% | 7.1% |
| Interquartile Range (IQR) | 3.1% | 2.5% |
| Standard Deviation (Sample) | 3.3% | 4.1% |
| Standard Deviation (Population) | 3.3% | 4.1% |
Demographics Similar to Hawaiians and Immigrants from Brazil by Female Unemployment
In terms of female unemployment, the demographic groups most similar to Hawaiians are Soviet Union (5.4%, a difference of 0.040%), Tsimshian (5.4%, a difference of 0.080%), Immigrants from Middle Africa (5.4%, a difference of 0.12%), Iroquois (5.4%, a difference of 0.12%), and Alsatian (5.3%, a difference of 0.14%). Similarly, the demographic groups most similar to Immigrants from Brazil are Immigrants from Afghanistan (5.4%, a difference of 0.020%), Immigrants from Israel (5.4%, a difference of 0.090%), Immigrants from South Eastern Asia (5.4%, a difference of 0.15%), Immigrants from Middle Africa (5.4%, a difference of 0.19%), and Iroquois (5.4%, a difference of 0.19%).
| Demographics | Rating | Rank | Female Unemployment |
| Portuguese | 28.6 /100 | #192 | Fair 5.3% |
| Arabs | 27.7 /100 | #193 | Fair 5.3% |
| Colombians | 27.0 /100 | #194 | Fair 5.3% |
| Immigrants | Colombia | 26.2 /100 | #195 | Fair 5.3% |
| Spaniards | 25.2 /100 | #196 | Fair 5.3% |
| Alsatians | 23.9 /100 | #197 | Fair 5.3% |
| Tsimshian | 23.1 /100 | #198 | Fair 5.4% |
| Hawaiians | 22.2 /100 | #199 | Fair 5.4% |
| Soviet Union | 21.7 /100 | #200 | Fair 5.4% |
| Immigrants | Middle Africa | 20.8 /100 | #201 | Fair 5.4% |
| Iroquois | 20.8 /100 | #202 | Fair 5.4% |
| Immigrants | South Eastern Asia | 20.3 /100 | #203 | Fair 5.4% |
| Immigrants | Israel | 19.7 /100 | #204 | Poor 5.4% |
| Immigrants | Afghanistan | 18.9 /100 | #205 | Poor 5.4% |
| Immigrants | Brazil | 18.8 /100 | #206 | Poor 5.4% |
| Creek | 15.4 /100 | #207 | Poor 5.4% |
| Immigrants | Costa Rica | 13.7 /100 | #208 | Poor 5.4% |
| Koreans | 13.4 /100 | #209 | Poor 5.4% |
| Choctaw | 12.3 /100 | #210 | Poor 5.4% |
| Ottawa | 11.6 /100 | #211 | Poor 5.4% |
| Uruguayans | 11.4 /100 | #212 | Poor 5.4% |