Immigrants from Ireland vs Immigrants from Brazil Female Unemployment
COMPARE
Immigrants from Ireland
Immigrants from Brazil
Female Unemployment
Female Unemployment Comparison
Immigrants from Ireland
Immigrants from Brazil
4.9%
FEMALE UNEMPLOYMENT
98.2/ 100
METRIC RATING
69th/ 347
METRIC RANK
5.4%
FEMALE UNEMPLOYMENT
18.8/ 100
METRIC RATING
206th/ 347
METRIC RANK
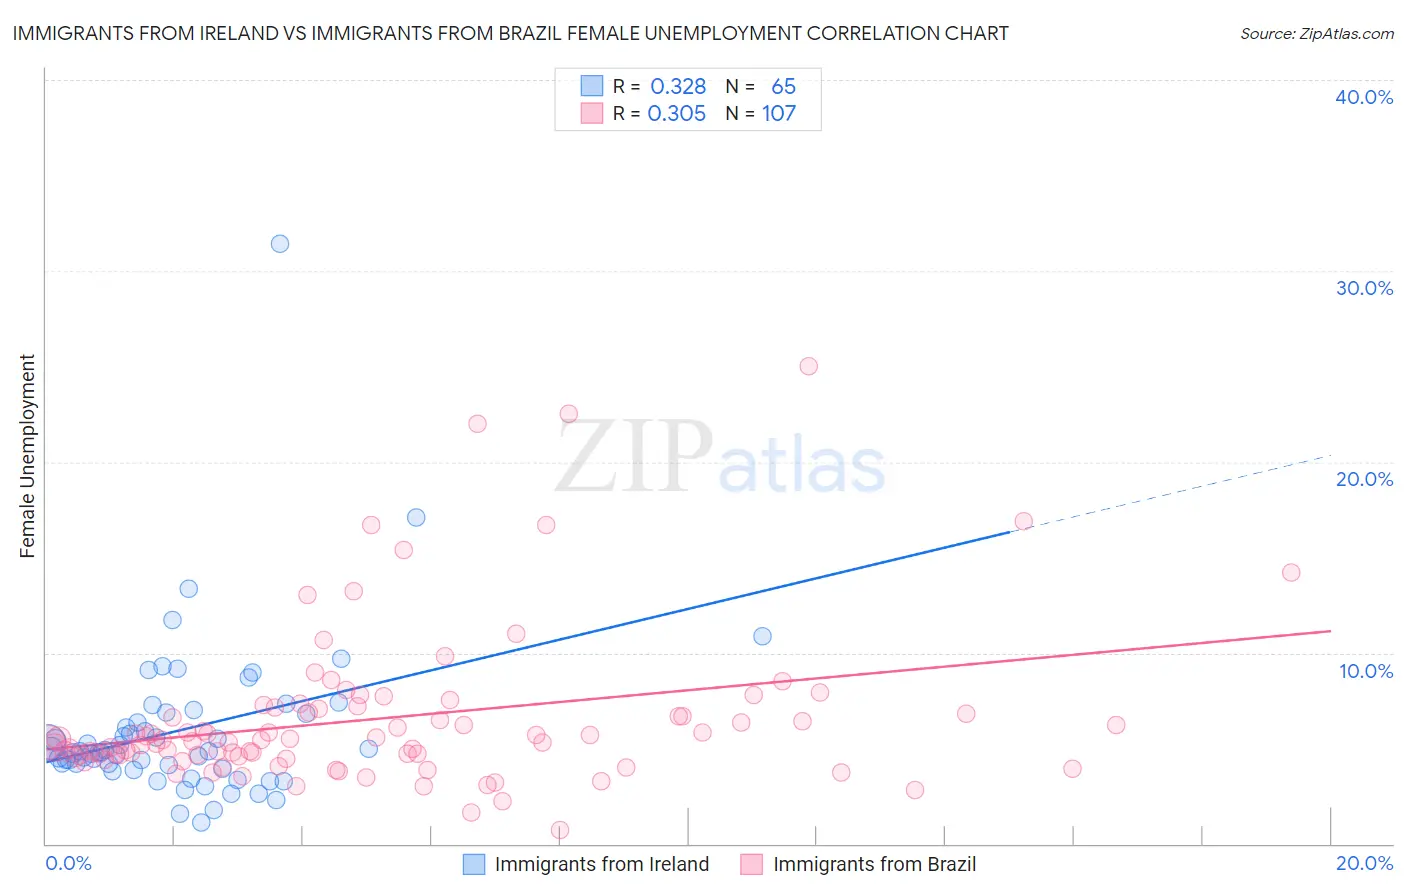
Immigrants from Ireland vs Immigrants from Brazil Female Unemployment Correlation Chart
The statistical analysis conducted on geographies consisting of 240,082,728 people shows a mild positive correlation between the proportion of Immigrants from Ireland and unemploymnet rate among females in the United States with a correlation coefficient (R) of 0.328 and weighted average of 4.9%. Similarly, the statistical analysis conducted on geographies consisting of 341,906,511 people shows a mild positive correlation between the proportion of Immigrants from Brazil and unemploymnet rate among females in the United States with a correlation coefficient (R) of 0.305 and weighted average of 5.4%, a difference of 8.8%.
Female Unemployment Correlation Summary
| Measurement | Immigrants from Ireland | Immigrants from Brazil |
| Minimum | 1.1% | 0.70% |
| Maximum | 31.4% | 25.0% |
| Range | 30.3% | 24.3% |
| Mean | 5.9% | 6.5% |
| Median | 4.9% | 5.4% |
| Interquartile 25% (IQ1) | 4.0% | 4.6% |
| Interquartile 75% (IQ3) | 6.8% | 7.1% |
| Interquartile Range (IQR) | 2.8% | 2.5% |
| Standard Deviation (Sample) | 4.3% | 4.1% |
| Standard Deviation (Population) | 4.2% | 4.1% |
Similar Demographics by Female Unemployment
Demographics Similar to Immigrants from Ireland by Female Unemployment
In terms of female unemployment, the demographic groups most similar to Immigrants from Ireland are Tlingit-Haida (4.9%, a difference of 0.010%), Hungarian (4.9%, a difference of 0.020%), Cuban (4.9%, a difference of 0.020%), Osage (4.9%, a difference of 0.040%), and Immigrants from North America (4.9%, a difference of 0.050%).
| Demographics | Rating | Rank | Female Unemployment |
| Immigrants | Nepal | 98.6 /100 | #62 | Exceptional 4.9% |
| Immigrants | Belgium | 98.5 /100 | #63 | Exceptional 4.9% |
| Celtics | 98.5 /100 | #64 | Exceptional 4.9% |
| Immigrants | North America | 98.3 /100 | #65 | Exceptional 4.9% |
| Hungarians | 98.3 /100 | #66 | Exceptional 4.9% |
| Cubans | 98.3 /100 | #67 | Exceptional 4.9% |
| Tlingit-Haida | 98.3 /100 | #68 | Exceptional 4.9% |
| Immigrants | Ireland | 98.2 /100 | #69 | Exceptional 4.9% |
| Osage | 98.2 /100 | #70 | Exceptional 4.9% |
| German Russians | 98.1 /100 | #71 | Exceptional 4.9% |
| Immigrants | Northern Europe | 98.0 /100 | #72 | Exceptional 4.9% |
| Russians | 98.0 /100 | #73 | Exceptional 5.0% |
| Immigrants | Bolivia | 98.0 /100 | #74 | Exceptional 5.0% |
| Immigrants | Singapore | 98.0 /100 | #75 | Exceptional 5.0% |
| Immigrants | Venezuela | 97.9 /100 | #76 | Exceptional 5.0% |
Demographics Similar to Immigrants from Brazil by Female Unemployment
In terms of female unemployment, the demographic groups most similar to Immigrants from Brazil are Immigrants from Afghanistan (5.4%, a difference of 0.020%), Immigrants from Israel (5.4%, a difference of 0.090%), Immigrants from South Eastern Asia (5.4%, a difference of 0.15%), Immigrants from Middle Africa (5.4%, a difference of 0.19%), and Iroquois (5.4%, a difference of 0.19%).
| Demographics | Rating | Rank | Female Unemployment |
| Hawaiians | 22.2 /100 | #199 | Fair 5.4% |
| Soviet Union | 21.7 /100 | #200 | Fair 5.4% |
| Immigrants | Middle Africa | 20.8 /100 | #201 | Fair 5.4% |
| Iroquois | 20.8 /100 | #202 | Fair 5.4% |
| Immigrants | South Eastern Asia | 20.3 /100 | #203 | Fair 5.4% |
| Immigrants | Israel | 19.7 /100 | #204 | Poor 5.4% |
| Immigrants | Afghanistan | 18.9 /100 | #205 | Poor 5.4% |
| Immigrants | Brazil | 18.8 /100 | #206 | Poor 5.4% |
| Creek | 15.4 /100 | #207 | Poor 5.4% |
| Immigrants | Costa Rica | 13.7 /100 | #208 | Poor 5.4% |
| Koreans | 13.4 /100 | #209 | Poor 5.4% |
| Choctaw | 12.3 /100 | #210 | Poor 5.4% |
| Ottawa | 11.6 /100 | #211 | Poor 5.4% |
| Uruguayans | 11.4 /100 | #212 | Poor 5.4% |
| Samoans | 10.6 /100 | #213 | Poor 5.4% |