Alaskan Athabascan vs Immigrants from Brazil Female Unemployment
COMPARE
Alaskan Athabascan
Immigrants from Brazil
Female Unemployment
Female Unemployment Comparison
Alaskan Athabascans
Immigrants from Brazil
6.1%
FEMALE UNEMPLOYMENT
0.0/ 100
METRIC RATING
296th/ 347
METRIC RANK
5.4%
FEMALE UNEMPLOYMENT
18.8/ 100
METRIC RATING
206th/ 347
METRIC RANK
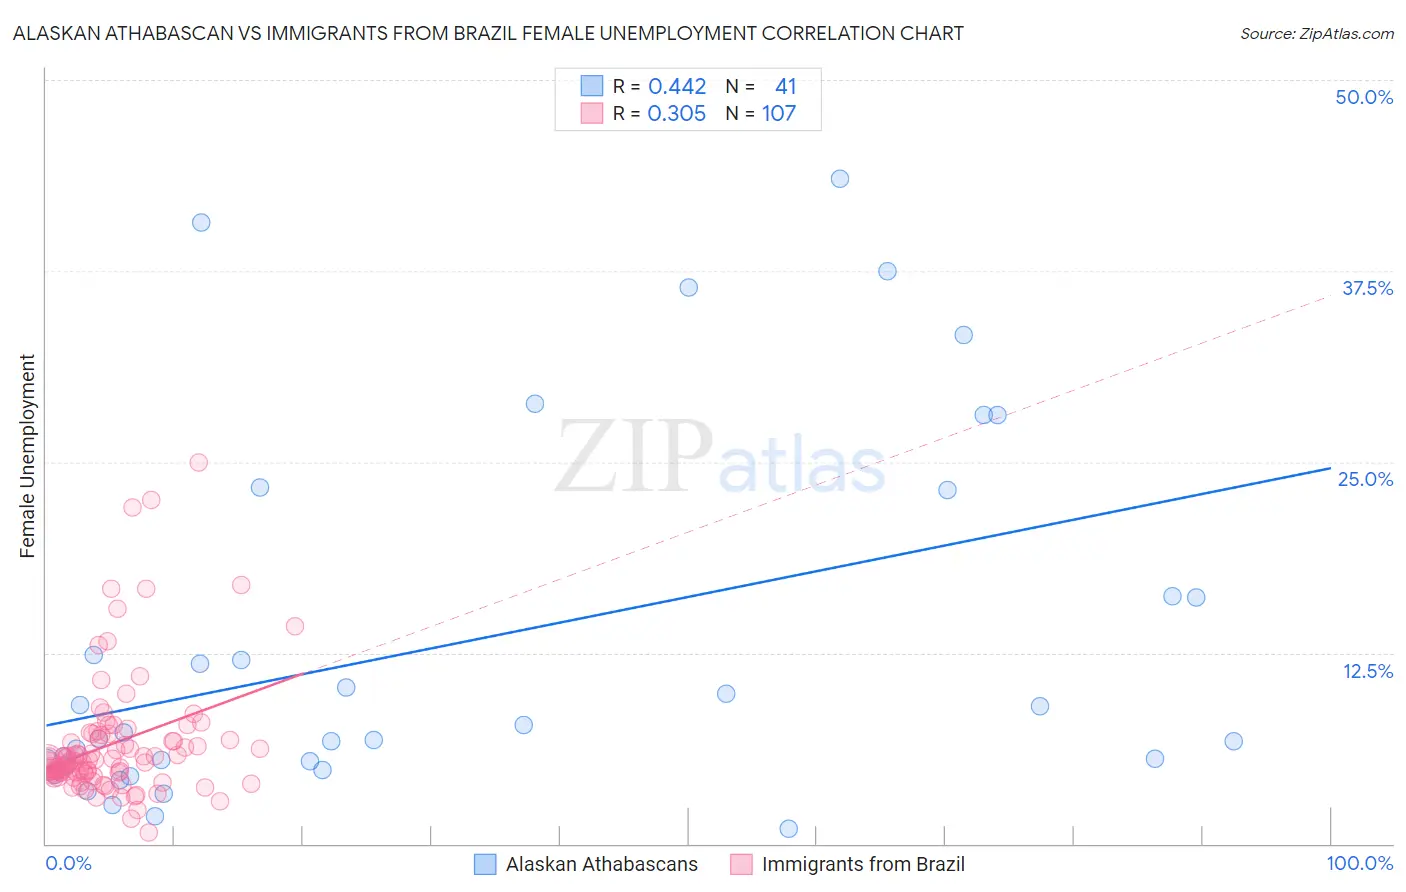
Alaskan Athabascan vs Immigrants from Brazil Female Unemployment Correlation Chart
The statistical analysis conducted on geographies consisting of 45,741,943 people shows a moderate positive correlation between the proportion of Alaskan Athabascans and unemploymnet rate among females in the United States with a correlation coefficient (R) of 0.442 and weighted average of 6.1%. Similarly, the statistical analysis conducted on geographies consisting of 341,906,511 people shows a mild positive correlation between the proportion of Immigrants from Brazil and unemploymnet rate among females in the United States with a correlation coefficient (R) of 0.305 and weighted average of 5.4%, a difference of 13.9%.
Female Unemployment Correlation Summary
| Measurement | Alaskan Athabascan | Immigrants from Brazil |
| Minimum | 1.0% | 0.70% |
| Maximum | 43.5% | 25.0% |
| Range | 42.5% | 24.3% |
| Mean | 13.2% | 6.5% |
| Median | 7.3% | 5.4% |
| Interquartile 25% (IQ1) | 5.2% | 4.6% |
| Interquartile 75% (IQ3) | 19.7% | 7.1% |
| Interquartile Range (IQR) | 14.4% | 2.5% |
| Standard Deviation (Sample) | 11.9% | 4.1% |
| Standard Deviation (Population) | 11.8% | 4.1% |
Similar Demographics by Female Unemployment
Demographics Similar to Alaskan Athabascans by Female Unemployment
In terms of female unemployment, the demographic groups most similar to Alaskan Athabascans are West Indian (6.1%, a difference of 0.010%), Immigrants from Latin America (6.1%, a difference of 0.020%), Jamaican (6.1%, a difference of 0.030%), Immigrants from El Salvador (6.1%, a difference of 0.12%), and Ute (6.1%, a difference of 0.13%).
| Demographics | Rating | Rank | Female Unemployment |
| Trinidadians and Tobagonians | 0.0 /100 | #289 | Tragic 6.1% |
| Immigrants | Caribbean | 0.0 /100 | #290 | Tragic 6.1% |
| Immigrants | West Indies | 0.0 /100 | #291 | Tragic 6.1% |
| Immigrants | Trinidad and Tobago | 0.0 /100 | #292 | Tragic 6.1% |
| Mexicans | 0.0 /100 | #293 | Tragic 6.1% |
| Immigrants | El Salvador | 0.0 /100 | #294 | Tragic 6.1% |
| Immigrants | Latin America | 0.0 /100 | #295 | Tragic 6.1% |
| Alaskan Athabascans | 0.0 /100 | #296 | Tragic 6.1% |
| West Indians | 0.0 /100 | #297 | Tragic 6.1% |
| Jamaicans | 0.0 /100 | #298 | Tragic 6.1% |
| Ute | 0.0 /100 | #299 | Tragic 6.1% |
| Immigrants | Haiti | 0.0 /100 | #300 | Tragic 6.1% |
| Immigrants | Barbados | 0.0 /100 | #301 | Tragic 6.2% |
| U.S. Virgin Islanders | 0.0 /100 | #302 | Tragic 6.2% |
| Barbadians | 0.0 /100 | #303 | Tragic 6.2% |
Demographics Similar to Immigrants from Brazil by Female Unemployment
In terms of female unemployment, the demographic groups most similar to Immigrants from Brazil are Immigrants from Afghanistan (5.4%, a difference of 0.020%), Immigrants from Israel (5.4%, a difference of 0.090%), Immigrants from South Eastern Asia (5.4%, a difference of 0.15%), Immigrants from Middle Africa (5.4%, a difference of 0.19%), and Iroquois (5.4%, a difference of 0.19%).
| Demographics | Rating | Rank | Female Unemployment |
| Hawaiians | 22.2 /100 | #199 | Fair 5.4% |
| Soviet Union | 21.7 /100 | #200 | Fair 5.4% |
| Immigrants | Middle Africa | 20.8 /100 | #201 | Fair 5.4% |
| Iroquois | 20.8 /100 | #202 | Fair 5.4% |
| Immigrants | South Eastern Asia | 20.3 /100 | #203 | Fair 5.4% |
| Immigrants | Israel | 19.7 /100 | #204 | Poor 5.4% |
| Immigrants | Afghanistan | 18.9 /100 | #205 | Poor 5.4% |
| Immigrants | Brazil | 18.8 /100 | #206 | Poor 5.4% |
| Creek | 15.4 /100 | #207 | Poor 5.4% |
| Immigrants | Costa Rica | 13.7 /100 | #208 | Poor 5.4% |
| Koreans | 13.4 /100 | #209 | Poor 5.4% |
| Choctaw | 12.3 /100 | #210 | Poor 5.4% |
| Ottawa | 11.6 /100 | #211 | Poor 5.4% |
| Uruguayans | 11.4 /100 | #212 | Poor 5.4% |
| Samoans | 10.6 /100 | #213 | Poor 5.4% |