Lumbee vs German Russian Female Unemployment
COMPARE
Lumbee
German Russian
Female Unemployment
Female Unemployment Comparison
Lumbee
German Russians
5.9%
FEMALE UNEMPLOYMENT
0.0/ 100
METRIC RATING
272nd/ 347
METRIC RANK
4.9%
FEMALE UNEMPLOYMENT
98.1/ 100
METRIC RATING
71st/ 347
METRIC RANK
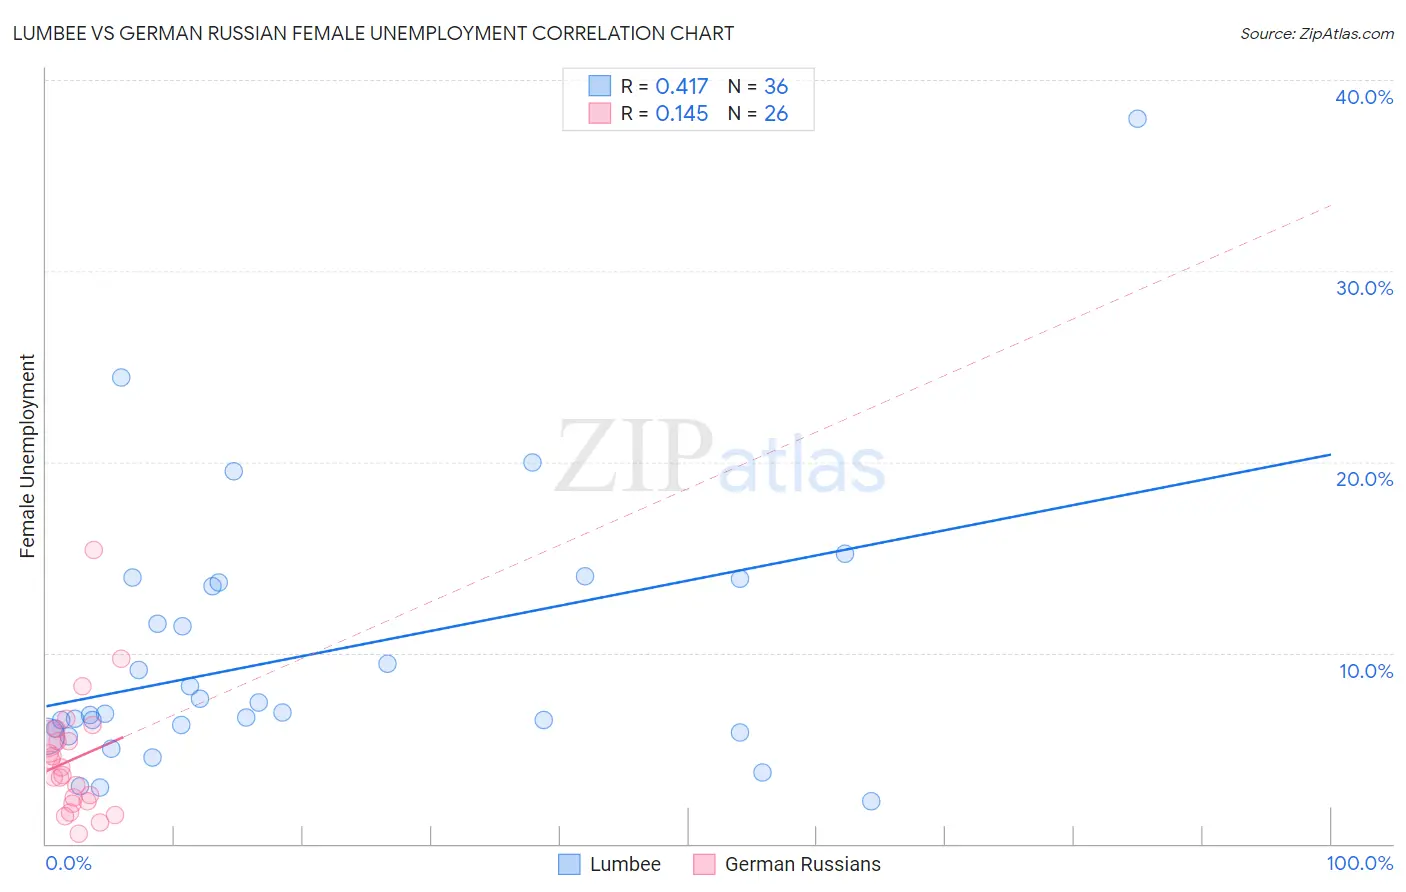
Lumbee vs German Russian Female Unemployment Correlation Chart
The statistical analysis conducted on geographies consisting of 92,134,947 people shows a moderate positive correlation between the proportion of Lumbee and unemploymnet rate among females in the United States with a correlation coefficient (R) of 0.417 and weighted average of 5.9%. Similarly, the statistical analysis conducted on geographies consisting of 96,182,011 people shows a poor positive correlation between the proportion of German Russians and unemploymnet rate among females in the United States with a correlation coefficient (R) of 0.145 and weighted average of 4.9%, a difference of 20.2%.
Female Unemployment Correlation Summary
| Measurement | Lumbee | German Russian |
| Minimum | 2.2% | 0.50% |
| Maximum | 38.0% | 15.4% |
| Range | 35.8% | 14.9% |
| Mean | 9.8% | 4.4% |
| Median | 6.9% | 3.8% |
| Interquartile 25% (IQ1) | 5.9% | 2.2% |
| Interquartile 75% (IQ3) | 13.6% | 5.5% |
| Interquartile Range (IQR) | 7.7% | 3.3% |
| Standard Deviation (Sample) | 7.0% | 3.2% |
| Standard Deviation (Population) | 6.9% | 3.1% |
Similar Demographics by Female Unemployment
Demographics Similar to Lumbee by Female Unemployment
In terms of female unemployment, the demographic groups most similar to Lumbee are Ghanaian (5.9%, a difference of 0.010%), African (5.9%, a difference of 0.090%), Central American (5.9%, a difference of 0.19%), Immigrants from Honduras (5.9%, a difference of 0.29%), and Senegalese (6.0%, a difference of 0.58%).
| Demographics | Rating | Rank | Female Unemployment |
| Blackfeet | 0.0 /100 | #265 | Tragic 5.9% |
| Cape Verdeans | 0.0 /100 | #266 | Tragic 5.9% |
| Nepalese | 0.0 /100 | #267 | Tragic 5.9% |
| Hondurans | 0.0 /100 | #268 | Tragic 5.9% |
| Immigrants | Western Africa | 0.0 /100 | #269 | Tragic 5.9% |
| Immigrants | Honduras | 0.0 /100 | #270 | Tragic 5.9% |
| Central Americans | 0.0 /100 | #271 | Tragic 5.9% |
| Lumbee | 0.0 /100 | #272 | Tragic 5.9% |
| Ghanaians | 0.0 /100 | #273 | Tragic 5.9% |
| Africans | 0.0 /100 | #274 | Tragic 5.9% |
| Senegalese | 0.0 /100 | #275 | Tragic 6.0% |
| Bahamians | 0.0 /100 | #276 | Tragic 6.0% |
| Immigrants | Ghana | 0.0 /100 | #277 | Tragic 6.0% |
| Yaqui | 0.0 /100 | #278 | Tragic 6.0% |
| Armenians | 0.0 /100 | #279 | Tragic 6.0% |
Demographics Similar to German Russians by Female Unemployment
In terms of female unemployment, the demographic groups most similar to German Russians are Immigrants from Northern Europe (4.9%, a difference of 0.070%), Osage (4.9%, a difference of 0.080%), Russian (5.0%, a difference of 0.10%), Immigrants from Bolivia (5.0%, a difference of 0.11%), and Immigrants from Ireland (4.9%, a difference of 0.12%).
| Demographics | Rating | Rank | Female Unemployment |
| Celtics | 98.5 /100 | #64 | Exceptional 4.9% |
| Immigrants | North America | 98.3 /100 | #65 | Exceptional 4.9% |
| Hungarians | 98.3 /100 | #66 | Exceptional 4.9% |
| Cubans | 98.3 /100 | #67 | Exceptional 4.9% |
| Tlingit-Haida | 98.3 /100 | #68 | Exceptional 4.9% |
| Immigrants | Ireland | 98.2 /100 | #69 | Exceptional 4.9% |
| Osage | 98.2 /100 | #70 | Exceptional 4.9% |
| German Russians | 98.1 /100 | #71 | Exceptional 4.9% |
| Immigrants | Northern Europe | 98.0 /100 | #72 | Exceptional 4.9% |
| Russians | 98.0 /100 | #73 | Exceptional 5.0% |
| Immigrants | Bolivia | 98.0 /100 | #74 | Exceptional 5.0% |
| Immigrants | Singapore | 98.0 /100 | #75 | Exceptional 5.0% |
| Immigrants | Venezuela | 97.9 /100 | #76 | Exceptional 5.0% |
| Mongolians | 97.8 /100 | #77 | Exceptional 5.0% |
| Immigrants | Netherlands | 97.8 /100 | #78 | Exceptional 5.0% |