Lebanese vs Yugoslavian Unemployment Among Women with Children Under 6 years
COMPARE
Lebanese
Yugoslavian
Unemployment Among Women with Children Under 6 years
Unemployment Among Women with Children Under 6 years Comparison
Lebanese
Yugoslavians
7.8%
UNEMPLOYMENT AMONG WOMEN WITH CHILDREN UNDER 6 YEARS
22.2/ 100
METRIC RATING
204th/ 347
METRIC RANK
7.7%
UNEMPLOYMENT AMONG WOMEN WITH CHILDREN UNDER 6 YEARS
39.4/ 100
METRIC RATING
186th/ 347
METRIC RANK
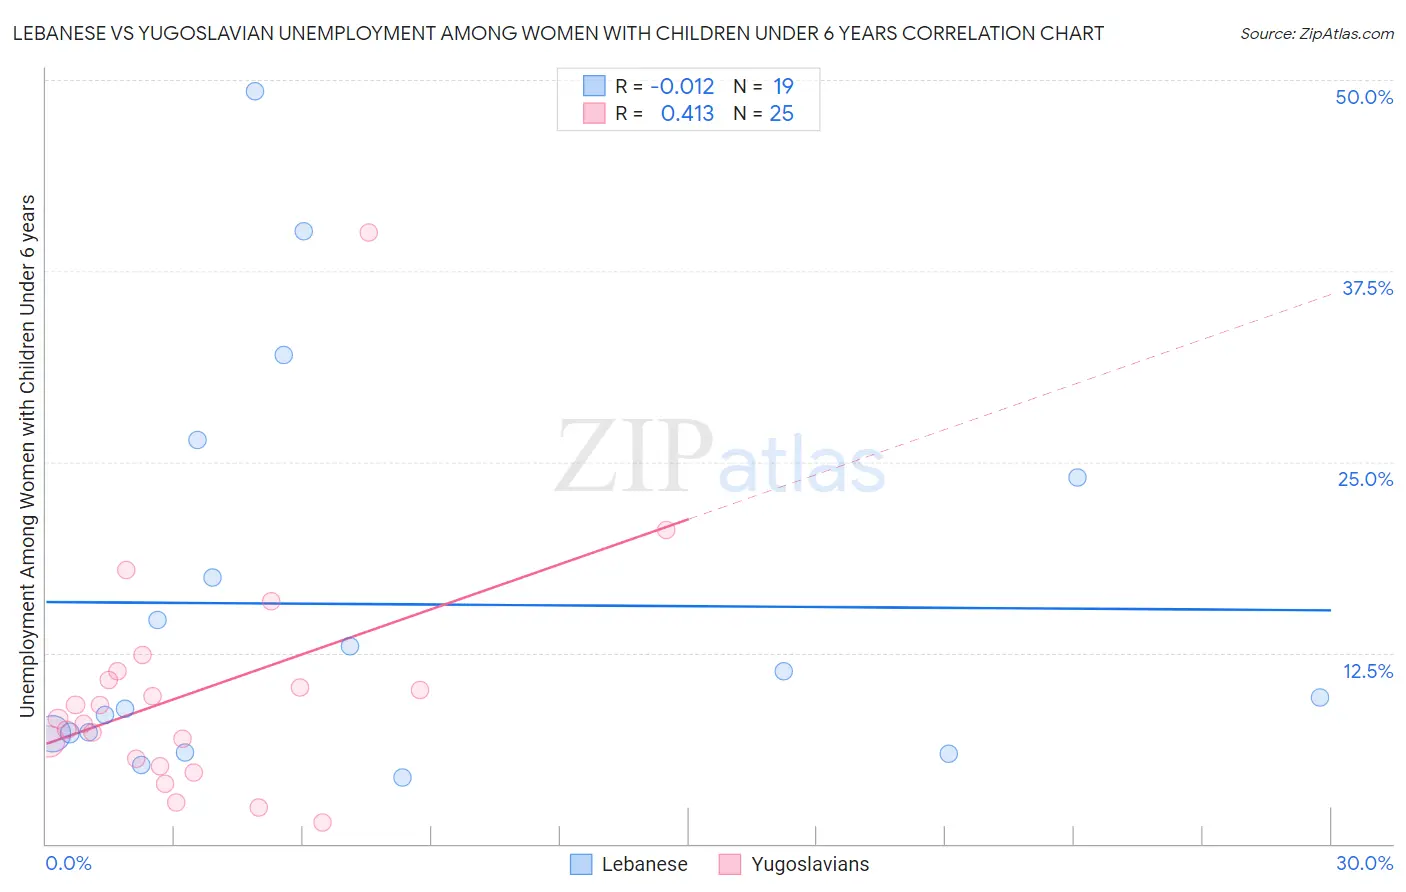
Lebanese vs Yugoslavian Unemployment Among Women with Children Under 6 years Correlation Chart
The statistical analysis conducted on geographies consisting of 301,337,117 people shows no correlation between the proportion of Lebanese and unemployment rate among women with children under the age of 6 in the United States with a correlation coefficient (R) of -0.012 and weighted average of 7.8%. Similarly, the statistical analysis conducted on geographies consisting of 225,026,278 people shows a moderate positive correlation between the proportion of Yugoslavians and unemployment rate among women with children under the age of 6 in the United States with a correlation coefficient (R) of 0.413 and weighted average of 7.7%, a difference of 1.4%.
Unemployment Among Women with Children Under 6 years Correlation Summary
| Measurement | Lebanese | Yugoslavian |
| Minimum | 4.3% | 1.4% |
| Maximum | 49.3% | 40.0% |
| Range | 45.0% | 38.6% |
| Mean | 15.7% | 9.9% |
| Median | 9.6% | 8.2% |
| Interquartile 25% (IQ1) | 7.2% | 5.3% |
| Interquartile 75% (IQ3) | 24.0% | 11.0% |
| Interquartile Range (IQR) | 16.8% | 5.7% |
| Standard Deviation (Sample) | 12.9% | 7.8% |
| Standard Deviation (Population) | 12.5% | 7.6% |
Demographics Similar to Lebanese and Yugoslavians by Unemployment Among Women with Children Under 6 years
In terms of unemployment among women with children under 6 years, the demographic groups most similar to Lebanese are Immigrants (7.8%, a difference of 0.080%), Spaniard (7.8%, a difference of 0.11%), Sudanese (7.8%, a difference of 0.12%), Basque (7.8%, a difference of 0.23%), and Guamanian/Chamorro (7.8%, a difference of 0.30%). Similarly, the demographic groups most similar to Yugoslavians are Spanish American (7.7%, a difference of 0.020%), Immigrants from Thailand (7.7%, a difference of 0.060%), Czechoslovakian (7.7%, a difference of 0.060%), Immigrants from Panama (7.7%, a difference of 0.26%), and Immigrants from North Macedonia (7.7%, a difference of 0.35%).
| Demographics | Rating | Rank | Unemployment Among Women with Children Under 6 years |
| Spanish Americans | 39.7 /100 | #185 | Fair 7.7% |
| Yugoslavians | 39.4 /100 | #186 | Fair 7.7% |
| Immigrants | Thailand | 38.5 /100 | #187 | Fair 7.7% |
| Czechoslovakians | 38.4 /100 | #188 | Fair 7.7% |
| Immigrants | Panama | 35.7 /100 | #189 | Fair 7.7% |
| Immigrants | North Macedonia | 34.4 /100 | #190 | Fair 7.7% |
| Immigrants | Austria | 32.4 /100 | #191 | Fair 7.7% |
| Immigrants | Africa | 32.4 /100 | #192 | Fair 7.7% |
| Slavs | 32.4 /100 | #193 | Fair 7.7% |
| Syrians | 31.9 /100 | #194 | Fair 7.7% |
| Malaysians | 31.1 /100 | #195 | Fair 7.7% |
| Immigrants | St. Vincent and the Grenadines | 31.1 /100 | #196 | Fair 7.7% |
| Italians | 30.4 /100 | #197 | Fair 7.7% |
| Lithuanians | 30.0 /100 | #198 | Fair 7.8% |
| Immigrants | Poland | 27.3 /100 | #199 | Fair 7.8% |
| Guamanians/Chamorros | 25.5 /100 | #200 | Fair 7.8% |
| Basques | 24.7 /100 | #201 | Fair 7.8% |
| Sudanese | 23.5 /100 | #202 | Fair 7.8% |
| Spaniards | 23.3 /100 | #203 | Fair 7.8% |
| Lebanese | 22.2 /100 | #204 | Fair 7.8% |
| Immigrants | Immigrants | 21.4 /100 | #205 | Fair 7.8% |