Lebanese vs Immigrants from Bangladesh Unemployment Among Women with Children Under 6 years
COMPARE
Lebanese
Immigrants from Bangladesh
Unemployment Among Women with Children Under 6 years
Unemployment Among Women with Children Under 6 years Comparison
Lebanese
Immigrants from Bangladesh
7.8%
UNEMPLOYMENT AMONG WOMEN WITH CHILDREN UNDER 6 YEARS
22.2/ 100
METRIC RATING
204th/ 347
METRIC RANK
8.8%
UNEMPLOYMENT AMONG WOMEN WITH CHILDREN UNDER 6 YEARS
0.0/ 100
METRIC RATING
293rd/ 347
METRIC RANK
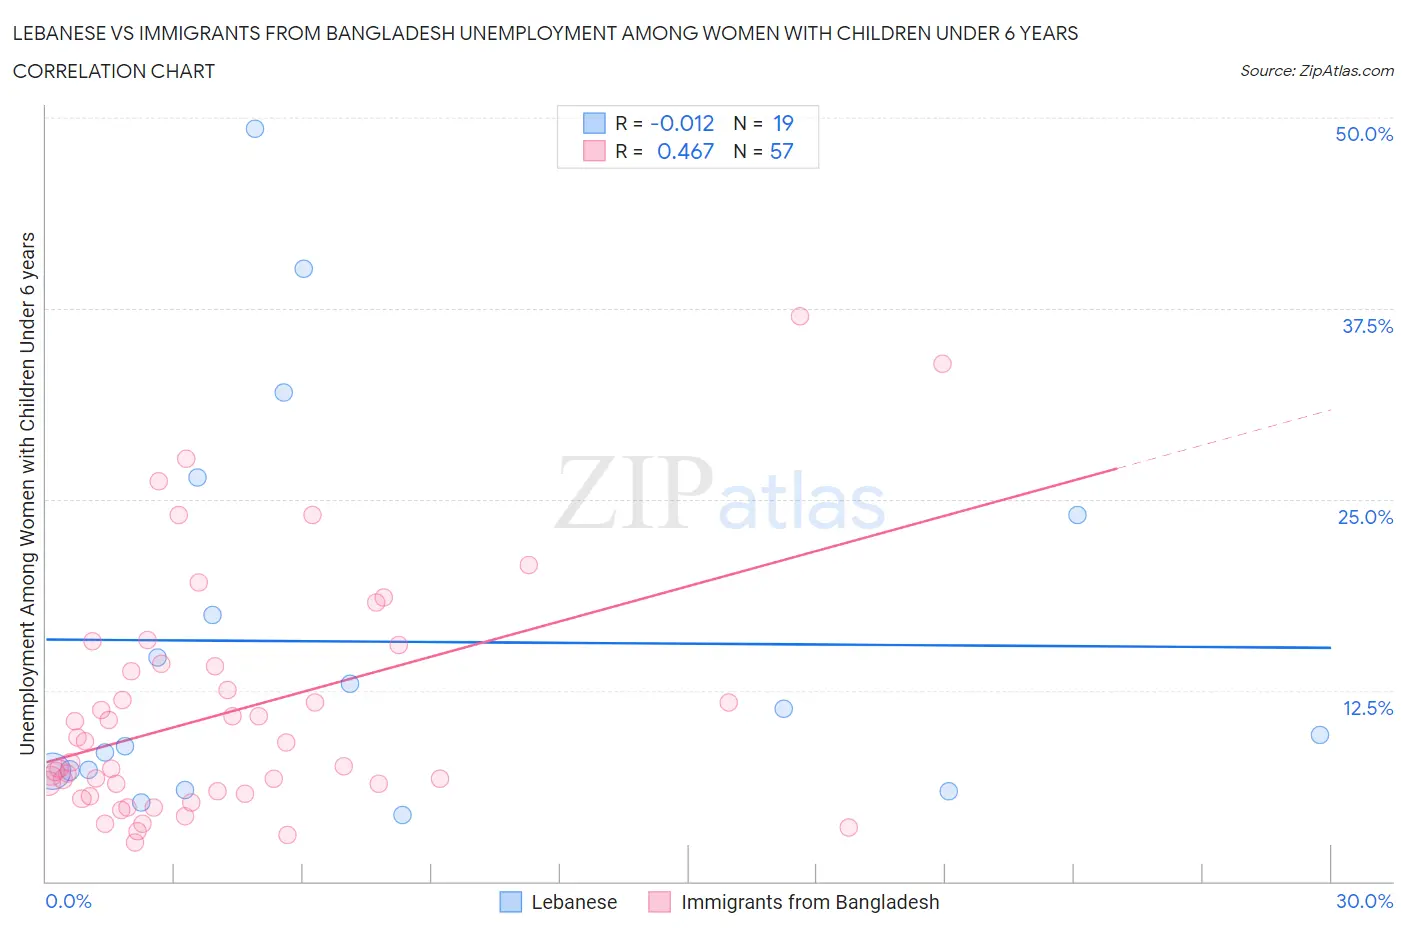
Lebanese vs Immigrants from Bangladesh Unemployment Among Women with Children Under 6 years Correlation Chart
The statistical analysis conducted on geographies consisting of 301,337,117 people shows no correlation between the proportion of Lebanese and unemployment rate among women with children under the age of 6 in the United States with a correlation coefficient (R) of -0.012 and weighted average of 7.8%. Similarly, the statistical analysis conducted on geographies consisting of 173,597,971 people shows a moderate positive correlation between the proportion of Immigrants from Bangladesh and unemployment rate among women with children under the age of 6 in the United States with a correlation coefficient (R) of 0.467 and weighted average of 8.8%, a difference of 13.2%.
Unemployment Among Women with Children Under 6 years Correlation Summary
| Measurement | Lebanese | Immigrants from Bangladesh |
| Minimum | 4.3% | 2.5% |
| Maximum | 49.3% | 37.0% |
| Range | 45.0% | 34.5% |
| Mean | 15.7% | 11.1% |
| Median | 9.6% | 7.8% |
| Interquartile 25% (IQ1) | 7.2% | 5.8% |
| Interquartile 75% (IQ3) | 24.0% | 14.2% |
| Interquartile Range (IQR) | 16.8% | 8.4% |
| Standard Deviation (Sample) | 12.9% | 7.7% |
| Standard Deviation (Population) | 12.5% | 7.6% |
Similar Demographics by Unemployment Among Women with Children Under 6 years
Demographics Similar to Lebanese by Unemployment Among Women with Children Under 6 years
In terms of unemployment among women with children under 6 years, the demographic groups most similar to Lebanese are Immigrants (7.8%, a difference of 0.080%), Hungarian (7.8%, a difference of 0.10%), Spaniard (7.8%, a difference of 0.11%), Sudanese (7.8%, a difference of 0.12%), and Canadian (7.8%, a difference of 0.15%).
| Demographics | Rating | Rank | Unemployment Among Women with Children Under 6 years |
| Italians | 30.4 /100 | #197 | Fair 7.7% |
| Lithuanians | 30.0 /100 | #198 | Fair 7.8% |
| Immigrants | Poland | 27.3 /100 | #199 | Fair 7.8% |
| Guamanians/Chamorros | 25.5 /100 | #200 | Fair 7.8% |
| Basques | 24.7 /100 | #201 | Fair 7.8% |
| Sudanese | 23.5 /100 | #202 | Fair 7.8% |
| Spaniards | 23.3 /100 | #203 | Fair 7.8% |
| Lebanese | 22.2 /100 | #204 | Fair 7.8% |
| Immigrants | Immigrants | 21.4 /100 | #205 | Fair 7.8% |
| Hungarians | 21.2 /100 | #206 | Fair 7.8% |
| Canadians | 20.6 /100 | #207 | Fair 7.8% |
| Immigrants | Syria | 18.9 /100 | #208 | Poor 7.8% |
| Costa Ricans | 17.6 /100 | #209 | Poor 7.8% |
| Poles | 16.0 /100 | #210 | Poor 7.9% |
| Immigrants | Ecuador | 14.9 /100 | #211 | Poor 7.9% |
Demographics Similar to Immigrants from Bangladesh by Unemployment Among Women with Children Under 6 years
In terms of unemployment among women with children under 6 years, the demographic groups most similar to Immigrants from Bangladesh are Nonimmigrants (8.8%, a difference of 0.19%), Cheyenne (8.8%, a difference of 0.23%), Immigrants from Central America (8.9%, a difference of 0.23%), Immigrants from Dominican Republic (8.9%, a difference of 0.36%), and Mexican (8.9%, a difference of 0.46%).
| Demographics | Rating | Rank | Unemployment Among Women with Children Under 6 years |
| Seminole | 0.0 /100 | #286 | Tragic 8.7% |
| Menominee | 0.0 /100 | #287 | Tragic 8.7% |
| Bahamians | 0.0 /100 | #288 | Tragic 8.7% |
| Iroquois | 0.0 /100 | #289 | Tragic 8.7% |
| Vietnamese | 0.0 /100 | #290 | Tragic 8.8% |
| Jamaicans | 0.0 /100 | #291 | Tragic 8.8% |
| Cheyenne | 0.0 /100 | #292 | Tragic 8.8% |
| Immigrants | Bangladesh | 0.0 /100 | #293 | Tragic 8.8% |
| Immigrants | Nonimmigrants | 0.0 /100 | #294 | Tragic 8.8% |
| Immigrants | Central America | 0.0 /100 | #295 | Tragic 8.9% |
| Immigrants | Dominican Republic | 0.0 /100 | #296 | Tragic 8.9% |
| Mexicans | 0.0 /100 | #297 | Tragic 8.9% |
| Tlingit-Haida | 0.0 /100 | #298 | Tragic 8.9% |
| Immigrants | Jamaica | 0.0 /100 | #299 | Tragic 8.9% |
| Creek | 0.0 /100 | #300 | Tragic 8.9% |