Lebanese vs Swiss Unemployment Among Women with Children Under 6 years
COMPARE
Lebanese
Swiss
Unemployment Among Women with Children Under 6 years
Unemployment Among Women with Children Under 6 years Comparison
Lebanese
Swiss
7.8%
UNEMPLOYMENT AMONG WOMEN WITH CHILDREN UNDER 6 YEARS
22.2/ 100
METRIC RATING
204th/ 347
METRIC RANK
7.9%
UNEMPLOYMENT AMONG WOMEN WITH CHILDREN UNDER 6 YEARS
12.3/ 100
METRIC RATING
212th/ 347
METRIC RANK
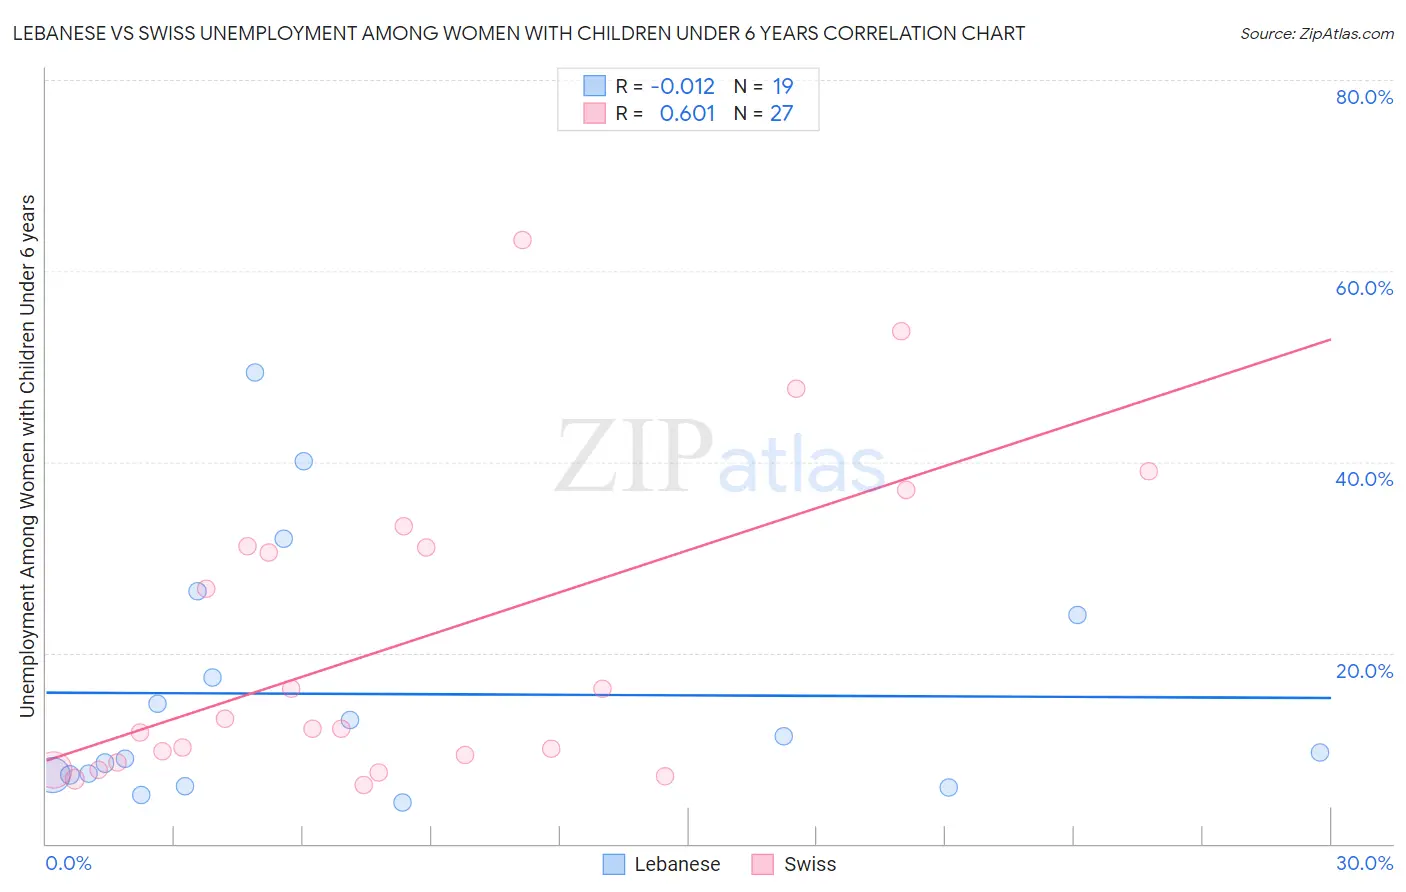
Lebanese vs Swiss Unemployment Among Women with Children Under 6 years Correlation Chart
The statistical analysis conducted on geographies consisting of 301,337,117 people shows no correlation between the proportion of Lebanese and unemployment rate among women with children under the age of 6 in the United States with a correlation coefficient (R) of -0.012 and weighted average of 7.8%. Similarly, the statistical analysis conducted on geographies consisting of 326,858,095 people shows a significant positive correlation between the proportion of Swiss and unemployment rate among women with children under the age of 6 in the United States with a correlation coefficient (R) of 0.601 and weighted average of 7.9%, a difference of 1.1%.
Unemployment Among Women with Children Under 6 years Correlation Summary
| Measurement | Lebanese | Swiss |
| Minimum | 4.3% | 6.2% |
| Maximum | 49.3% | 63.2% |
| Range | 45.0% | 57.1% |
| Mean | 15.7% | 20.9% |
| Median | 9.6% | 12.0% |
| Interquartile 25% (IQ1) | 7.2% | 8.5% |
| Interquartile 75% (IQ3) | 24.0% | 31.1% |
| Interquartile Range (IQR) | 16.8% | 22.6% |
| Standard Deviation (Sample) | 12.9% | 16.2% |
| Standard Deviation (Population) | 12.5% | 15.9% |
Demographics Similar to Lebanese and Swiss by Unemployment Among Women with Children Under 6 years
In terms of unemployment among women with children under 6 years, the demographic groups most similar to Lebanese are Immigrants (7.8%, a difference of 0.080%), Hungarian (7.8%, a difference of 0.10%), Spaniard (7.8%, a difference of 0.11%), Sudanese (7.8%, a difference of 0.12%), and Canadian (7.8%, a difference of 0.15%). Similarly, the demographic groups most similar to Swiss are Scottish (7.9%, a difference of 0.13%), Spanish (7.9%, a difference of 0.16%), Ecuadorian (7.9%, a difference of 0.17%), Immigrants from Lebanon (7.9%, a difference of 0.19%), and Immigrants from Nigeria (7.9%, a difference of 0.31%).
| Demographics | Rating | Rank | Unemployment Among Women with Children Under 6 years |
| Lithuanians | 30.0 /100 | #198 | Fair 7.8% |
| Immigrants | Poland | 27.3 /100 | #199 | Fair 7.8% |
| Guamanians/Chamorros | 25.5 /100 | #200 | Fair 7.8% |
| Basques | 24.7 /100 | #201 | Fair 7.8% |
| Sudanese | 23.5 /100 | #202 | Fair 7.8% |
| Spaniards | 23.3 /100 | #203 | Fair 7.8% |
| Lebanese | 22.2 /100 | #204 | Fair 7.8% |
| Immigrants | Immigrants | 21.4 /100 | #205 | Fair 7.8% |
| Hungarians | 21.2 /100 | #206 | Fair 7.8% |
| Canadians | 20.6 /100 | #207 | Fair 7.8% |
| Immigrants | Syria | 18.9 /100 | #208 | Poor 7.8% |
| Costa Ricans | 17.6 /100 | #209 | Poor 7.8% |
| Poles | 16.0 /100 | #210 | Poor 7.9% |
| Immigrants | Ecuador | 14.9 /100 | #211 | Poor 7.9% |
| Swiss | 12.3 /100 | #212 | Poor 7.9% |
| Scottish | 11.4 /100 | #213 | Poor 7.9% |
| Spanish | 11.3 /100 | #214 | Poor 7.9% |
| Ecuadorians | 11.2 /100 | #215 | Poor 7.9% |
| Immigrants | Lebanon | 11.1 /100 | #216 | Poor 7.9% |
| Immigrants | Nigeria | 10.3 /100 | #217 | Poor 7.9% |
| Moroccans | 9.7 /100 | #218 | Tragic 7.9% |