Lebanese vs Yugoslavian Single Father Poverty
COMPARE
Lebanese
Yugoslavian
Single Father Poverty
Single Father Poverty Comparison
Lebanese
Yugoslavians
17.7%
SINGLE FATHER POVERTY
0.0/ 100
METRIC RATING
277th/ 347
METRIC RANK
16.3%
SINGLE FATHER POVERTY
53.9/ 100
METRIC RATING
167th/ 347
METRIC RANK
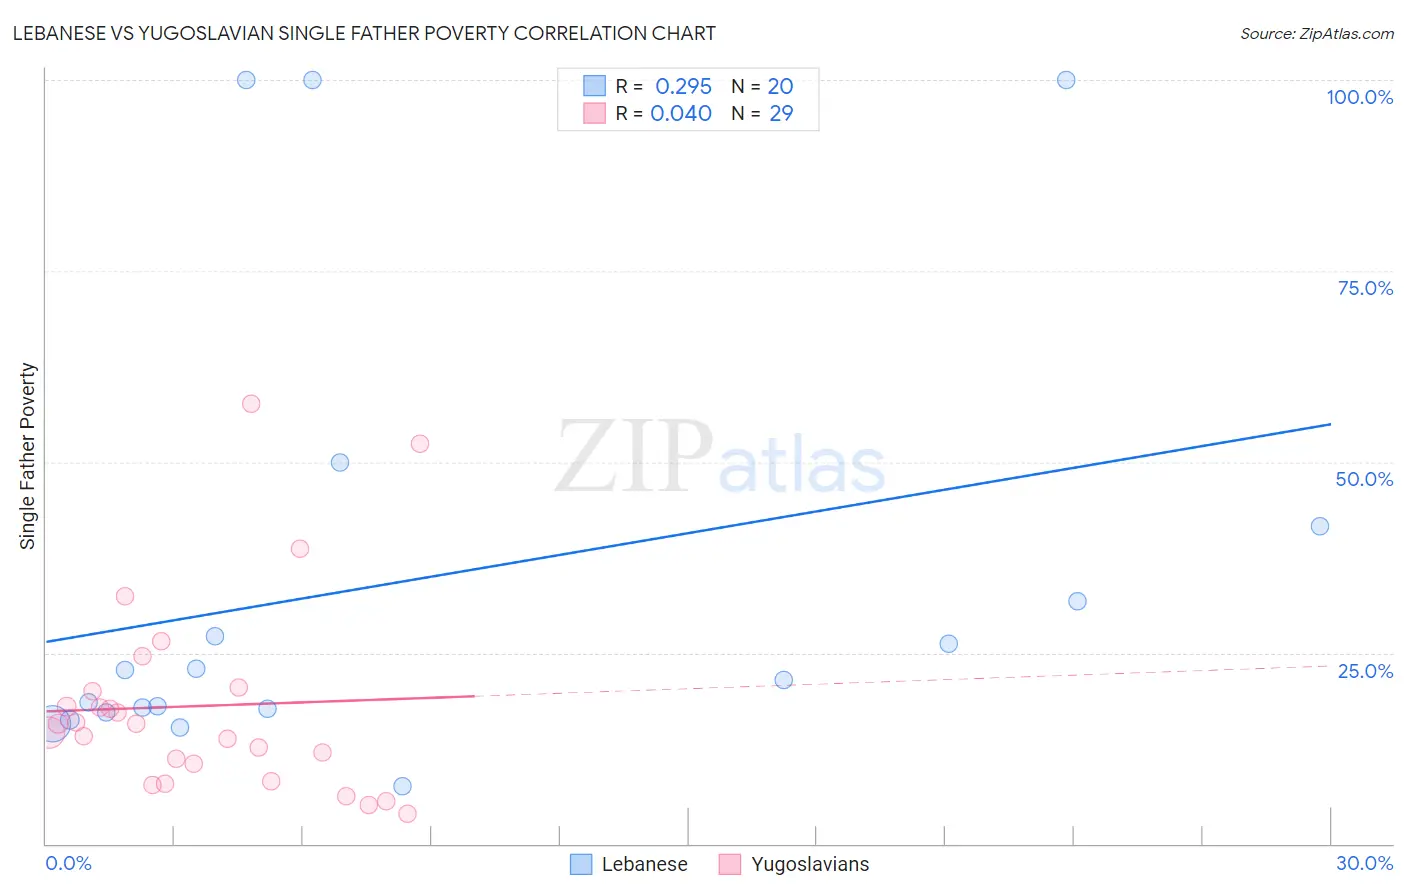
Lebanese vs Yugoslavian Single Father Poverty Correlation Chart
The statistical analysis conducted on geographies consisting of 311,744,378 people shows a weak positive correlation between the proportion of Lebanese and poverty level among single fathers in the United States with a correlation coefficient (R) of 0.295 and weighted average of 17.7%. Similarly, the statistical analysis conducted on geographies consisting of 233,019,111 people shows no correlation between the proportion of Yugoslavians and poverty level among single fathers in the United States with a correlation coefficient (R) of 0.040 and weighted average of 16.3%, a difference of 8.9%.
Single Father Poverty Correlation Summary
| Measurement | Lebanese | Yugoslavian |
| Minimum | 7.5% | 4.0% |
| Maximum | 100.0% | 57.7% |
| Range | 92.5% | 53.7% |
| Mean | 34.4% | 18.0% |
| Median | 22.2% | 15.7% |
| Interquartile 25% (IQ1) | 17.4% | 9.3% |
| Interquartile 75% (IQ3) | 36.6% | 20.2% |
| Interquartile Range (IQR) | 19.2% | 10.9% |
| Standard Deviation (Sample) | 29.8% | 13.0% |
| Standard Deviation (Population) | 29.1% | 12.8% |
Similar Demographics by Single Father Poverty
Demographics Similar to Lebanese by Single Father Poverty
In terms of single father poverty, the demographic groups most similar to Lebanese are German (17.7%, a difference of 0.010%), German Russian (17.7%, a difference of 0.15%), Iroquois (17.7%, a difference of 0.16%), Scottish (17.7%, a difference of 0.20%), and British West Indian (17.7%, a difference of 0.21%).
| Demographics | Rating | Rank | Single Father Poverty |
| Indonesians | 0.2 /100 | #270 | Tragic 17.4% |
| French American Indians | 0.2 /100 | #271 | Tragic 17.4% |
| Barbadians | 0.1 /100 | #272 | Tragic 17.5% |
| Italians | 0.1 /100 | #273 | Tragic 17.5% |
| Macedonians | 0.1 /100 | #274 | Tragic 17.7% |
| British West Indians | 0.0 /100 | #275 | Tragic 17.7% |
| German Russians | 0.0 /100 | #276 | Tragic 17.7% |
| Lebanese | 0.0 /100 | #277 | Tragic 17.7% |
| Germans | 0.0 /100 | #278 | Tragic 17.7% |
| Iroquois | 0.0 /100 | #279 | Tragic 17.7% |
| Scottish | 0.0 /100 | #280 | Tragic 17.7% |
| English | 0.0 /100 | #281 | Tragic 17.8% |
| Dutch | 0.0 /100 | #282 | Tragic 17.8% |
| Alsatians | 0.0 /100 | #283 | Tragic 17.8% |
| Welsh | 0.0 /100 | #284 | Tragic 17.8% |
Demographics Similar to Yugoslavians by Single Father Poverty
In terms of single father poverty, the demographic groups most similar to Yugoslavians are Costa Rican (16.3%, a difference of 0.010%), Immigrants from Europe (16.3%, a difference of 0.040%), Immigrants from Bangladesh (16.3%, a difference of 0.050%), Northern European (16.3%, a difference of 0.050%), and Guyanese (16.3%, a difference of 0.060%).
| Demographics | Rating | Rank | Single Father Poverty |
| Immigrants | Sudan | 59.8 /100 | #160 | Average 16.2% |
| Estonians | 56.7 /100 | #161 | Average 16.2% |
| Ugandans | 55.9 /100 | #162 | Average 16.3% |
| Immigrants | Costa Rica | 55.7 /100 | #163 | Average 16.3% |
| Guyanese | 55.2 /100 | #164 | Average 16.3% |
| Immigrants | Bangladesh | 55.1 /100 | #165 | Average 16.3% |
| Immigrants | Europe | 54.8 /100 | #166 | Average 16.3% |
| Yugoslavians | 53.9 /100 | #167 | Average 16.3% |
| Costa Ricans | 53.6 /100 | #168 | Average 16.3% |
| Northern Europeans | 52.8 /100 | #169 | Average 16.3% |
| Scandinavians | 52.3 /100 | #170 | Average 16.3% |
| Immigrants | Morocco | 50.7 /100 | #171 | Average 16.3% |
| Immigrants | Sierra Leone | 50.1 /100 | #172 | Average 16.3% |
| Immigrants | St. Vincent and the Grenadines | 50.0 /100 | #173 | Average 16.3% |
| Swedes | 50.0 /100 | #174 | Average 16.3% |