Immigrants from Belgium vs Yugoslavian Unemployment Among Women with Children Under 6 years
COMPARE
Immigrants from Belgium
Yugoslavian
Unemployment Among Women with Children Under 6 years
Unemployment Among Women with Children Under 6 years Comparison
Immigrants from Belgium
Yugoslavians
6.9%
UNEMPLOYMENT AMONG WOMEN WITH CHILDREN UNDER 6 YEARS
99.6/ 100
METRIC RATING
66th/ 347
METRIC RANK
7.7%
UNEMPLOYMENT AMONG WOMEN WITH CHILDREN UNDER 6 YEARS
39.4/ 100
METRIC RATING
186th/ 347
METRIC RANK
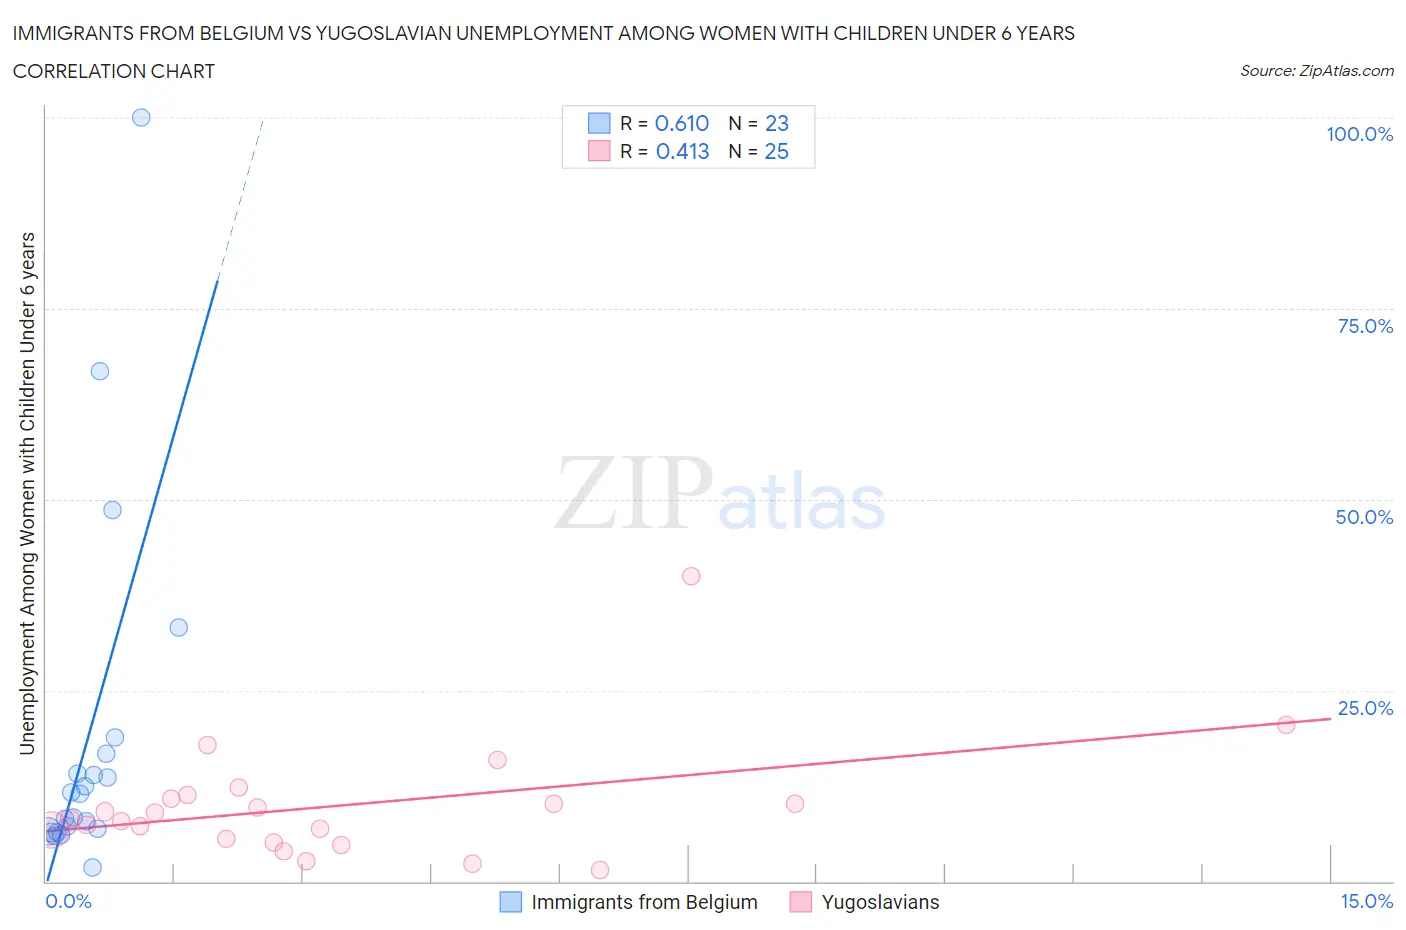
Immigrants from Belgium vs Yugoslavian Unemployment Among Women with Children Under 6 years Correlation Chart
The statistical analysis conducted on geographies consisting of 126,448,040 people shows a significant positive correlation between the proportion of Immigrants from Belgium and unemployment rate among women with children under the age of 6 in the United States with a correlation coefficient (R) of 0.610 and weighted average of 6.9%. Similarly, the statistical analysis conducted on geographies consisting of 225,026,278 people shows a moderate positive correlation between the proportion of Yugoslavians and unemployment rate among women with children under the age of 6 in the United States with a correlation coefficient (R) of 0.413 and weighted average of 7.7%, a difference of 10.9%.
Unemployment Among Women with Children Under 6 years Correlation Summary
| Measurement | Immigrants from Belgium | Yugoslavian |
| Minimum | 1.8% | 1.4% |
| Maximum | 100.0% | 40.0% |
| Range | 98.2% | 38.6% |
| Mean | 18.8% | 9.9% |
| Median | 11.4% | 8.2% |
| Interquartile 25% (IQ1) | 6.5% | 5.3% |
| Interquartile 75% (IQ3) | 16.7% | 11.0% |
| Interquartile Range (IQR) | 10.2% | 5.7% |
| Standard Deviation (Sample) | 23.3% | 7.8% |
| Standard Deviation (Population) | 22.7% | 7.6% |
Similar Demographics by Unemployment Among Women with Children Under 6 years
Demographics Similar to Immigrants from Belgium by Unemployment Among Women with Children Under 6 years
In terms of unemployment among women with children under 6 years, the demographic groups most similar to Immigrants from Belgium are Immigrants from Kuwait (6.9%, a difference of 0.22%), Tongan (6.9%, a difference of 0.37%), Immigrants from Netherlands (7.0%, a difference of 0.46%), Maltese (6.9%, a difference of 0.47%), and Somali (6.9%, a difference of 0.52%).
| Demographics | Rating | Rank | Unemployment Among Women with Children Under 6 years |
| Immigrants | Serbia | 99.8 /100 | #59 | Exceptional 6.9% |
| Immigrants | Sri Lanka | 99.8 /100 | #60 | Exceptional 6.9% |
| Immigrants | France | 99.7 /100 | #61 | Exceptional 6.9% |
| Somalis | 99.7 /100 | #62 | Exceptional 6.9% |
| Maltese | 99.7 /100 | #63 | Exceptional 6.9% |
| Tongans | 99.7 /100 | #64 | Exceptional 6.9% |
| Immigrants | Kuwait | 99.7 /100 | #65 | Exceptional 6.9% |
| Immigrants | Belgium | 99.6 /100 | #66 | Exceptional 6.9% |
| Immigrants | Netherlands | 99.5 /100 | #67 | Exceptional 7.0% |
| Paraguayans | 99.4 /100 | #68 | Exceptional 7.0% |
| Immigrants | Eritrea | 99.4 /100 | #69 | Exceptional 7.0% |
| Immigrants | Iraq | 99.4 /100 | #70 | Exceptional 7.0% |
| Afghans | 99.4 /100 | #71 | Exceptional 7.0% |
| Cubans | 99.4 /100 | #72 | Exceptional 7.0% |
| Immigrants | Czechoslovakia | 99.2 /100 | #73 | Exceptional 7.0% |
Demographics Similar to Yugoslavians by Unemployment Among Women with Children Under 6 years
In terms of unemployment among women with children under 6 years, the demographic groups most similar to Yugoslavians are Spanish American (7.7%, a difference of 0.020%), Immigrants from Thailand (7.7%, a difference of 0.060%), Czechoslovakian (7.7%, a difference of 0.060%), Indonesian (7.7%, a difference of 0.080%), and Sierra Leonean (7.7%, a difference of 0.24%).
| Demographics | Rating | Rank | Unemployment Among Women with Children Under 6 years |
| Immigrants | Western Europe | 44.9 /100 | #179 | Average 7.7% |
| Immigrants | Uruguay | 44.5 /100 | #180 | Average 7.7% |
| Brazilians | 43.9 /100 | #181 | Average 7.7% |
| Nepalese | 43.5 /100 | #182 | Average 7.7% |
| Sierra Leoneans | 42.9 /100 | #183 | Average 7.7% |
| Indonesians | 40.5 /100 | #184 | Average 7.7% |
| Spanish Americans | 39.7 /100 | #185 | Fair 7.7% |
| Yugoslavians | 39.4 /100 | #186 | Fair 7.7% |
| Immigrants | Thailand | 38.5 /100 | #187 | Fair 7.7% |
| Czechoslovakians | 38.4 /100 | #188 | Fair 7.7% |
| Immigrants | Panama | 35.7 /100 | #189 | Fair 7.7% |
| Immigrants | North Macedonia | 34.4 /100 | #190 | Fair 7.7% |
| Immigrants | Austria | 32.4 /100 | #191 | Fair 7.7% |
| Immigrants | Africa | 32.4 /100 | #192 | Fair 7.7% |
| Slavs | 32.4 /100 | #193 | Fair 7.7% |