Lebanese vs Slovene Unemployment Among Women with Children Under 6 years
COMPARE
Lebanese
Slovene
Unemployment Among Women with Children Under 6 years
Unemployment Among Women with Children Under 6 years Comparison
Lebanese
Slovenes
7.8%
UNEMPLOYMENT AMONG WOMEN WITH CHILDREN UNDER 6 YEARS
22.2/ 100
METRIC RATING
204th/ 347
METRIC RANK
7.4%
UNEMPLOYMENT AMONG WOMEN WITH CHILDREN UNDER 6 YEARS
89.2/ 100
METRIC RATING
129th/ 347
METRIC RANK
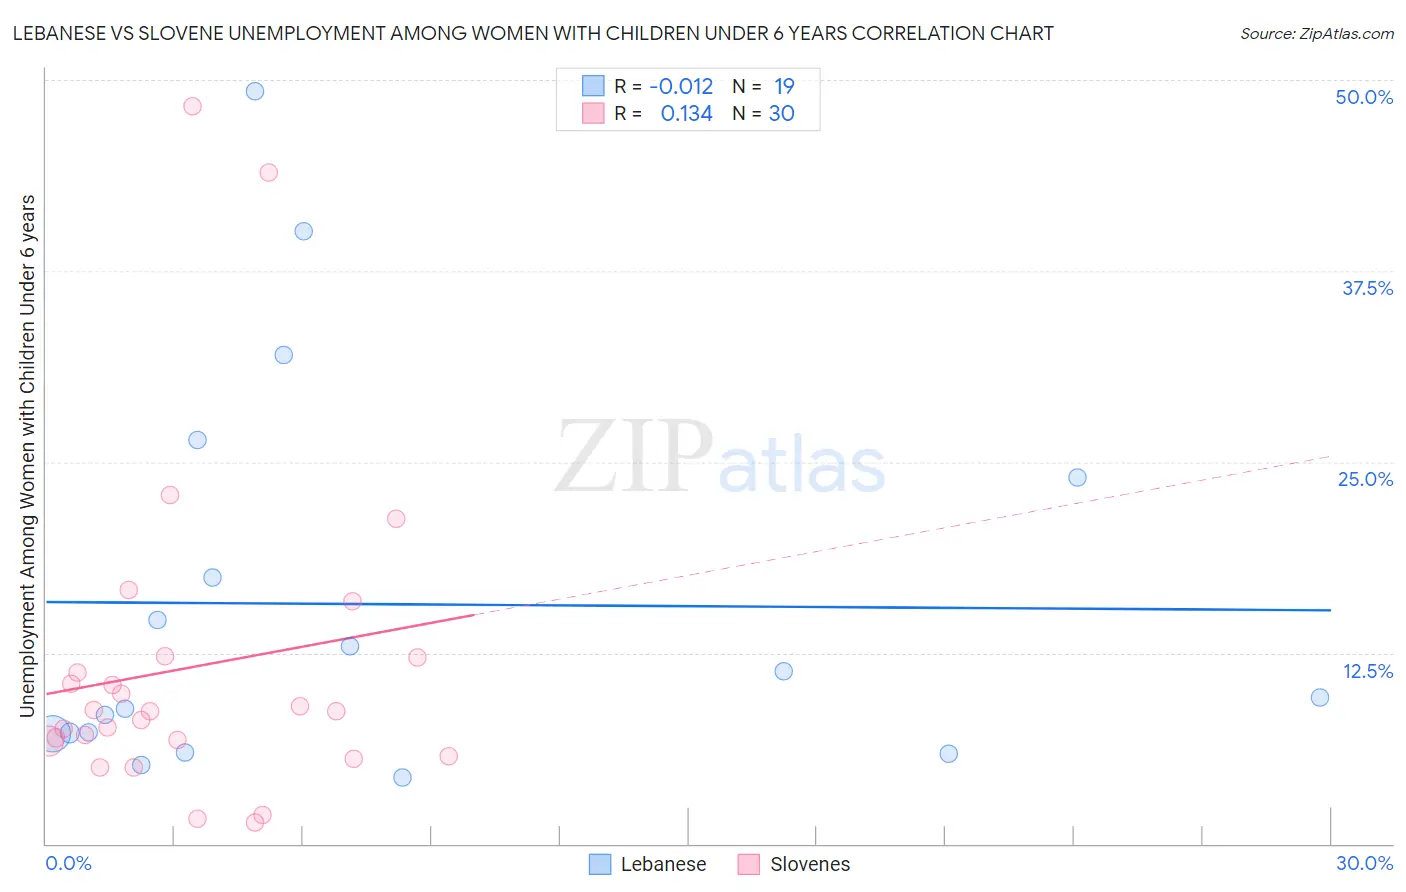
Lebanese vs Slovene Unemployment Among Women with Children Under 6 years Correlation Chart
The statistical analysis conducted on geographies consisting of 301,337,117 people shows no correlation between the proportion of Lebanese and unemployment rate among women with children under the age of 6 in the United States with a correlation coefficient (R) of -0.012 and weighted average of 7.8%. Similarly, the statistical analysis conducted on geographies consisting of 204,544,718 people shows a poor positive correlation between the proportion of Slovenes and unemployment rate among women with children under the age of 6 in the United States with a correlation coefficient (R) of 0.134 and weighted average of 7.4%, a difference of 5.8%.
Unemployment Among Women with Children Under 6 years Correlation Summary
| Measurement | Lebanese | Slovene |
| Minimum | 4.3% | 1.4% |
| Maximum | 49.3% | 48.3% |
| Range | 45.0% | 46.9% |
| Mean | 15.7% | 11.6% |
| Median | 9.6% | 8.7% |
| Interquartile 25% (IQ1) | 7.2% | 6.7% |
| Interquartile 75% (IQ3) | 24.0% | 12.2% |
| Interquartile Range (IQR) | 16.8% | 5.5% |
| Standard Deviation (Sample) | 12.9% | 10.6% |
| Standard Deviation (Population) | 12.5% | 10.5% |
Similar Demographics by Unemployment Among Women with Children Under 6 years
Demographics Similar to Lebanese by Unemployment Among Women with Children Under 6 years
In terms of unemployment among women with children under 6 years, the demographic groups most similar to Lebanese are Immigrants (7.8%, a difference of 0.080%), Hungarian (7.8%, a difference of 0.10%), Spaniard (7.8%, a difference of 0.11%), Sudanese (7.8%, a difference of 0.12%), and Canadian (7.8%, a difference of 0.15%).
| Demographics | Rating | Rank | Unemployment Among Women with Children Under 6 years |
| Italians | 30.4 /100 | #197 | Fair 7.7% |
| Lithuanians | 30.0 /100 | #198 | Fair 7.8% |
| Immigrants | Poland | 27.3 /100 | #199 | Fair 7.8% |
| Guamanians/Chamorros | 25.5 /100 | #200 | Fair 7.8% |
| Basques | 24.7 /100 | #201 | Fair 7.8% |
| Sudanese | 23.5 /100 | #202 | Fair 7.8% |
| Spaniards | 23.3 /100 | #203 | Fair 7.8% |
| Lebanese | 22.2 /100 | #204 | Fair 7.8% |
| Immigrants | Immigrants | 21.4 /100 | #205 | Fair 7.8% |
| Hungarians | 21.2 /100 | #206 | Fair 7.8% |
| Canadians | 20.6 /100 | #207 | Fair 7.8% |
| Immigrants | Syria | 18.9 /100 | #208 | Poor 7.8% |
| Costa Ricans | 17.6 /100 | #209 | Poor 7.8% |
| Poles | 16.0 /100 | #210 | Poor 7.9% |
| Immigrants | Ecuador | 14.9 /100 | #211 | Poor 7.9% |
Demographics Similar to Slovenes by Unemployment Among Women with Children Under 6 years
In terms of unemployment among women with children under 6 years, the demographic groups most similar to Slovenes are Swedish (7.4%, a difference of 0.14%), Ukrainian (7.4%, a difference of 0.17%), Immigrants from Armenia (7.4%, a difference of 0.30%), Immigrants from Uganda (7.4%, a difference of 0.43%), and Jordanian (7.3%, a difference of 0.45%).
| Demographics | Rating | Rank | Unemployment Among Women with Children Under 6 years |
| Immigrants | Bosnia and Herzegovina | 93.5 /100 | #122 | Exceptional 7.3% |
| Immigrants | Zaire | 93.3 /100 | #123 | Exceptional 7.3% |
| Immigrants | South Africa | 92.5 /100 | #124 | Exceptional 7.3% |
| Pakistanis | 92.2 /100 | #125 | Exceptional 7.3% |
| Immigrants | Burma/Myanmar | 91.9 /100 | #126 | Exceptional 7.3% |
| Jordanians | 91.5 /100 | #127 | Exceptional 7.3% |
| Zimbabweans | 91.5 /100 | #128 | Exceptional 7.3% |
| Slovenes | 89.2 /100 | #129 | Excellent 7.4% |
| Swedes | 88.4 /100 | #130 | Excellent 7.4% |
| Ukrainians | 88.2 /100 | #131 | Excellent 7.4% |
| Immigrants | Armenia | 87.4 /100 | #132 | Excellent 7.4% |
| Immigrants | Uganda | 86.5 /100 | #133 | Excellent 7.4% |
| Immigrants | Bolivia | 85.7 /100 | #134 | Excellent 7.4% |
| Immigrants | Northern Africa | 85.3 /100 | #135 | Excellent 7.4% |
| Immigrants | Morocco | 84.9 /100 | #136 | Excellent 7.4% |