Immigrants from Nigeria vs Yugoslavian Unemployment Among Women with Children Under 6 years
COMPARE
Immigrants from Nigeria
Yugoslavian
Unemployment Among Women with Children Under 6 years
Unemployment Among Women with Children Under 6 years Comparison
Immigrants from Nigeria
Yugoslavians
7.9%
UNEMPLOYMENT AMONG WOMEN WITH CHILDREN UNDER 6 YEARS
10.3/ 100
METRIC RATING
217th/ 347
METRIC RANK
7.7%
UNEMPLOYMENT AMONG WOMEN WITH CHILDREN UNDER 6 YEARS
39.4/ 100
METRIC RATING
186th/ 347
METRIC RANK
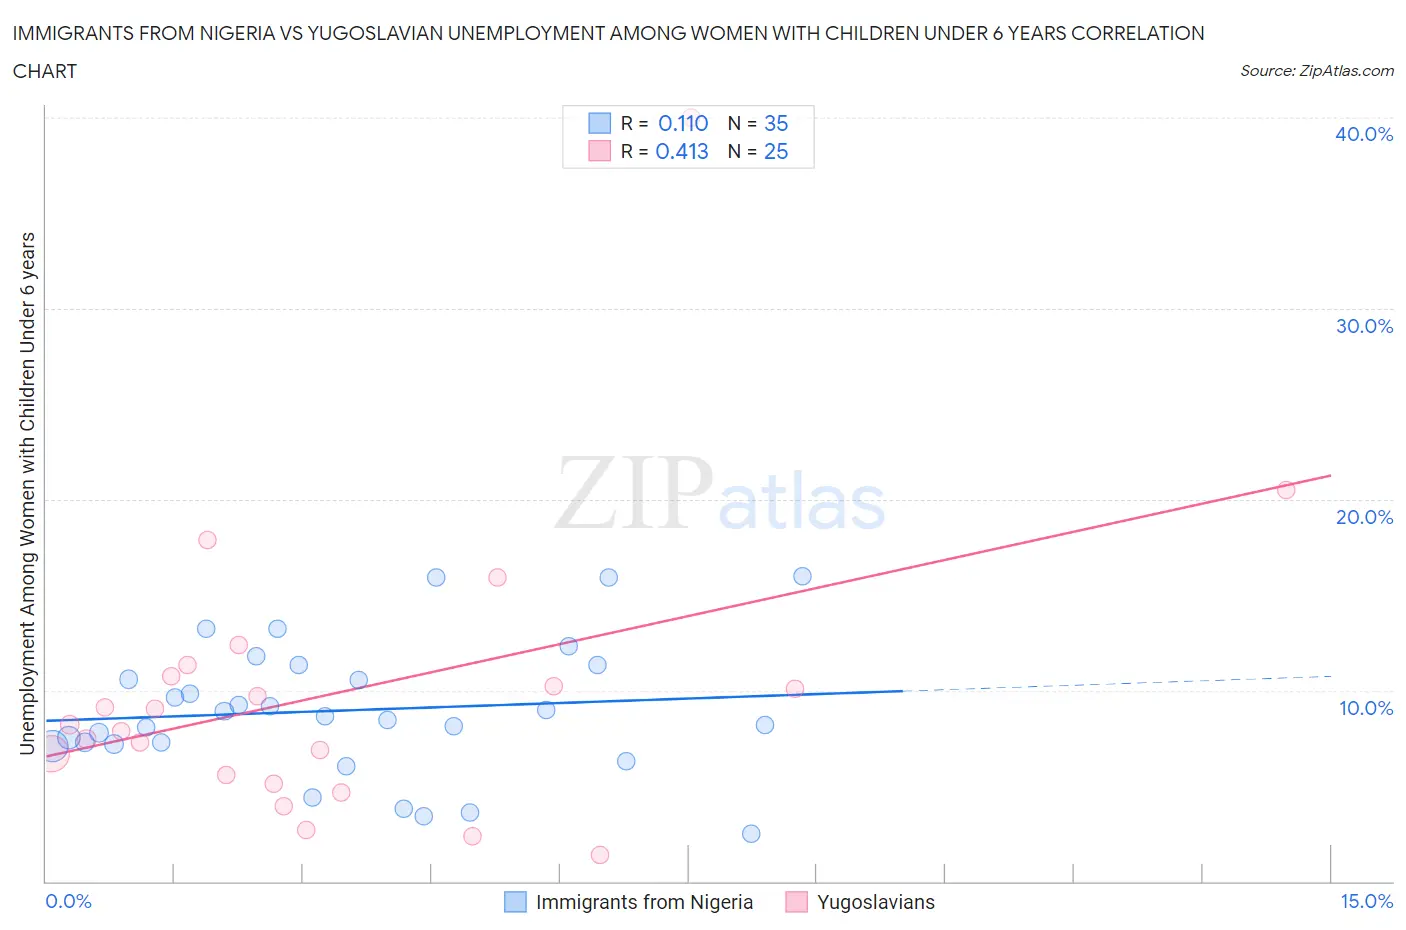
Immigrants from Nigeria vs Yugoslavian Unemployment Among Women with Children Under 6 years Correlation Chart
The statistical analysis conducted on geographies consisting of 235,747,701 people shows a poor positive correlation between the proportion of Immigrants from Nigeria and unemployment rate among women with children under the age of 6 in the United States with a correlation coefficient (R) of 0.110 and weighted average of 7.9%. Similarly, the statistical analysis conducted on geographies consisting of 225,026,278 people shows a moderate positive correlation between the proportion of Yugoslavians and unemployment rate among women with children under the age of 6 in the United States with a correlation coefficient (R) of 0.413 and weighted average of 7.7%, a difference of 2.8%.
Unemployment Among Women with Children Under 6 years Correlation Summary
| Measurement | Immigrants from Nigeria | Yugoslavian |
| Minimum | 2.5% | 1.4% |
| Maximum | 16.0% | 40.0% |
| Range | 13.5% | 38.6% |
| Mean | 9.0% | 9.9% |
| Median | 8.6% | 8.2% |
| Interquartile 25% (IQ1) | 7.2% | 5.3% |
| Interquartile 75% (IQ3) | 11.3% | 11.0% |
| Interquartile Range (IQR) | 4.1% | 5.7% |
| Standard Deviation (Sample) | 3.4% | 7.8% |
| Standard Deviation (Population) | 3.4% | 7.6% |
Similar Demographics by Unemployment Among Women with Children Under 6 years
Demographics Similar to Immigrants from Nigeria by Unemployment Among Women with Children Under 6 years
In terms of unemployment among women with children under 6 years, the demographic groups most similar to Immigrants from Nigeria are Moroccan (7.9%, a difference of 0.11%), Immigrants from Lebanon (7.9%, a difference of 0.12%), Ecuadorian (7.9%, a difference of 0.14%), Spanish (7.9%, a difference of 0.15%), and Scottish (7.9%, a difference of 0.17%).
| Demographics | Rating | Rank | Unemployment Among Women with Children Under 6 years |
| Poles | 16.0 /100 | #210 | Poor 7.9% |
| Immigrants | Ecuador | 14.9 /100 | #211 | Poor 7.9% |
| Swiss | 12.3 /100 | #212 | Poor 7.9% |
| Scottish | 11.4 /100 | #213 | Poor 7.9% |
| Spanish | 11.3 /100 | #214 | Poor 7.9% |
| Ecuadorians | 11.2 /100 | #215 | Poor 7.9% |
| Immigrants | Lebanon | 11.1 /100 | #216 | Poor 7.9% |
| Immigrants | Nigeria | 10.3 /100 | #217 | Poor 7.9% |
| Moroccans | 9.7 /100 | #218 | Tragic 7.9% |
| Arabs | 9.4 /100 | #219 | Tragic 7.9% |
| South American Indians | 9.3 /100 | #220 | Tragic 7.9% |
| Immigrants | Germany | 8.5 /100 | #221 | Tragic 7.9% |
| Samoans | 8.4 /100 | #222 | Tragic 7.9% |
| Carpatho Rusyns | 7.8 /100 | #223 | Tragic 8.0% |
| English | 7.2 /100 | #224 | Tragic 8.0% |
Demographics Similar to Yugoslavians by Unemployment Among Women with Children Under 6 years
In terms of unemployment among women with children under 6 years, the demographic groups most similar to Yugoslavians are Spanish American (7.7%, a difference of 0.020%), Immigrants from Thailand (7.7%, a difference of 0.060%), Czechoslovakian (7.7%, a difference of 0.060%), Indonesian (7.7%, a difference of 0.080%), and Sierra Leonean (7.7%, a difference of 0.24%).
| Demographics | Rating | Rank | Unemployment Among Women with Children Under 6 years |
| Immigrants | Western Europe | 44.9 /100 | #179 | Average 7.7% |
| Immigrants | Uruguay | 44.5 /100 | #180 | Average 7.7% |
| Brazilians | 43.9 /100 | #181 | Average 7.7% |
| Nepalese | 43.5 /100 | #182 | Average 7.7% |
| Sierra Leoneans | 42.9 /100 | #183 | Average 7.7% |
| Indonesians | 40.5 /100 | #184 | Average 7.7% |
| Spanish Americans | 39.7 /100 | #185 | Fair 7.7% |
| Yugoslavians | 39.4 /100 | #186 | Fair 7.7% |
| Immigrants | Thailand | 38.5 /100 | #187 | Fair 7.7% |
| Czechoslovakians | 38.4 /100 | #188 | Fair 7.7% |
| Immigrants | Panama | 35.7 /100 | #189 | Fair 7.7% |
| Immigrants | North Macedonia | 34.4 /100 | #190 | Fair 7.7% |
| Immigrants | Austria | 32.4 /100 | #191 | Fair 7.7% |
| Immigrants | Africa | 32.4 /100 | #192 | Fair 7.7% |
| Slavs | 32.4 /100 | #193 | Fair 7.7% |