Lebanese vs Immigrants from Congo Unemployment Among Women with Children Under 6 years
COMPARE
Lebanese
Immigrants from Congo
Unemployment Among Women with Children Under 6 years
Unemployment Among Women with Children Under 6 years Comparison
Lebanese
Immigrants from Congo
7.8%
UNEMPLOYMENT AMONG WOMEN WITH CHILDREN UNDER 6 YEARS
22.2/ 100
METRIC RATING
204th/ 347
METRIC RANK
8.5%
UNEMPLOYMENT AMONG WOMEN WITH CHILDREN UNDER 6 YEARS
0.2/ 100
METRIC RATING
271st/ 347
METRIC RANK
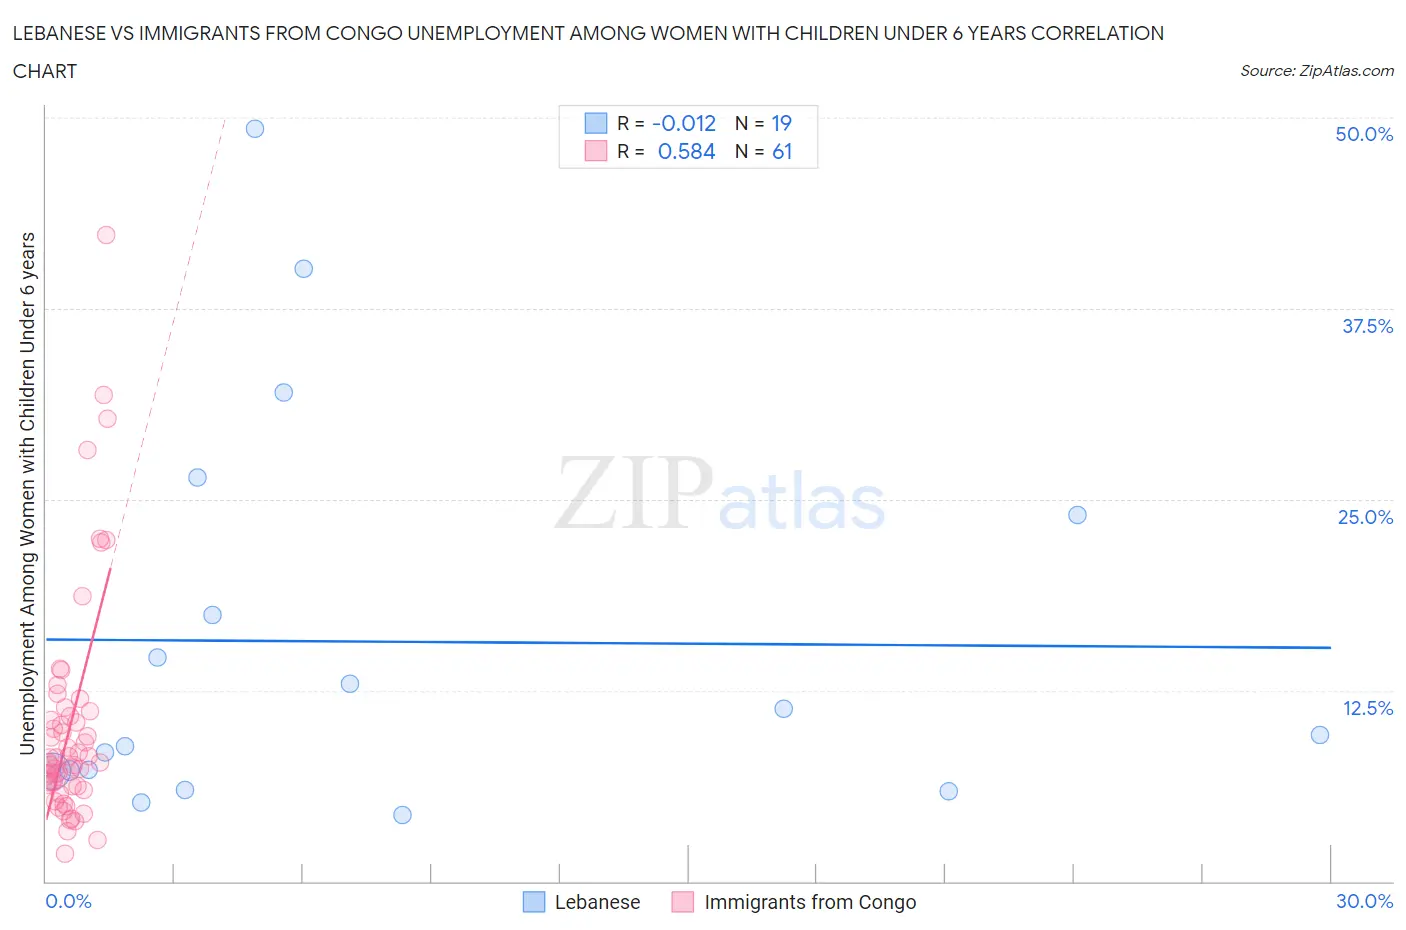
Lebanese vs Immigrants from Congo Unemployment Among Women with Children Under 6 years Correlation Chart
The statistical analysis conducted on geographies consisting of 301,337,117 people shows no correlation between the proportion of Lebanese and unemployment rate among women with children under the age of 6 in the United States with a correlation coefficient (R) of -0.012 and weighted average of 7.8%. Similarly, the statistical analysis conducted on geographies consisting of 85,861,208 people shows a substantial positive correlation between the proportion of Immigrants from Congo and unemployment rate among women with children under the age of 6 in the United States with a correlation coefficient (R) of 0.584 and weighted average of 8.5%, a difference of 8.5%.
Unemployment Among Women with Children Under 6 years Correlation Summary
| Measurement | Lebanese | Immigrants from Congo |
| Minimum | 4.3% | 1.8% |
| Maximum | 49.3% | 42.3% |
| Range | 45.0% | 40.5% |
| Mean | 15.7% | 10.2% |
| Median | 9.6% | 7.8% |
| Interquartile 25% (IQ1) | 7.2% | 6.2% |
| Interquartile 75% (IQ3) | 24.0% | 11.0% |
| Interquartile Range (IQR) | 16.8% | 4.8% |
| Standard Deviation (Sample) | 12.9% | 7.6% |
| Standard Deviation (Population) | 12.5% | 7.6% |
Similar Demographics by Unemployment Among Women with Children Under 6 years
Demographics Similar to Lebanese by Unemployment Among Women with Children Under 6 years
In terms of unemployment among women with children under 6 years, the demographic groups most similar to Lebanese are Immigrants (7.8%, a difference of 0.080%), Hungarian (7.8%, a difference of 0.10%), Spaniard (7.8%, a difference of 0.11%), Sudanese (7.8%, a difference of 0.12%), and Canadian (7.8%, a difference of 0.15%).
| Demographics | Rating | Rank | Unemployment Among Women with Children Under 6 years |
| Italians | 30.4 /100 | #197 | Fair 7.7% |
| Lithuanians | 30.0 /100 | #198 | Fair 7.8% |
| Immigrants | Poland | 27.3 /100 | #199 | Fair 7.8% |
| Guamanians/Chamorros | 25.5 /100 | #200 | Fair 7.8% |
| Basques | 24.7 /100 | #201 | Fair 7.8% |
| Sudanese | 23.5 /100 | #202 | Fair 7.8% |
| Spaniards | 23.3 /100 | #203 | Fair 7.8% |
| Lebanese | 22.2 /100 | #204 | Fair 7.8% |
| Immigrants | Immigrants | 21.4 /100 | #205 | Fair 7.8% |
| Hungarians | 21.2 /100 | #206 | Fair 7.8% |
| Canadians | 20.6 /100 | #207 | Fair 7.8% |
| Immigrants | Syria | 18.9 /100 | #208 | Poor 7.8% |
| Costa Ricans | 17.6 /100 | #209 | Poor 7.8% |
| Poles | 16.0 /100 | #210 | Poor 7.9% |
| Immigrants | Ecuador | 14.9 /100 | #211 | Poor 7.9% |
Demographics Similar to Immigrants from Congo by Unemployment Among Women with Children Under 6 years
In terms of unemployment among women with children under 6 years, the demographic groups most similar to Immigrants from Congo are Immigrants from Senegal (8.5%, a difference of 0.010%), Immigrants from Haiti (8.4%, a difference of 0.35%), Subsaharan African (8.4%, a difference of 0.43%), Belizean (8.4%, a difference of 0.54%), and Mexican American Indian (8.5%, a difference of 0.56%).
| Demographics | Rating | Rank | Unemployment Among Women with Children Under 6 years |
| Hondurans | 0.3 /100 | #264 | Tragic 8.4% |
| French Canadians | 0.3 /100 | #265 | Tragic 8.4% |
| Immigrants | Honduras | 0.3 /100 | #266 | Tragic 8.4% |
| Belizeans | 0.2 /100 | #267 | Tragic 8.4% |
| Sub-Saharan Africans | 0.2 /100 | #268 | Tragic 8.4% |
| Immigrants | Haiti | 0.2 /100 | #269 | Tragic 8.4% |
| Immigrants | Senegal | 0.2 /100 | #270 | Tragic 8.5% |
| Immigrants | Congo | 0.2 /100 | #271 | Tragic 8.5% |
| Mexican American Indians | 0.1 /100 | #272 | Tragic 8.5% |
| Slovaks | 0.1 /100 | #273 | Tragic 8.5% |
| Immigrants | Cameroon | 0.1 /100 | #274 | Tragic 8.6% |
| Immigrants | Latin America | 0.1 /100 | #275 | Tragic 8.6% |
| Yaqui | 0.0 /100 | #276 | Tragic 8.6% |
| Haitians | 0.0 /100 | #277 | Tragic 8.6% |
| Immigrants | Dominica | 0.0 /100 | #278 | Tragic 8.6% |