Irish vs Yugoslavian Unemployment Among Women with Children Under 6 years
COMPARE
Irish
Yugoslavian
Unemployment Among Women with Children Under 6 years
Unemployment Among Women with Children Under 6 years Comparison
Irish
Yugoslavians
8.1%
UNEMPLOYMENT AMONG WOMEN WITH CHILDREN UNDER 6 YEARS
2.7/ 100
METRIC RATING
239th/ 347
METRIC RANK
7.7%
UNEMPLOYMENT AMONG WOMEN WITH CHILDREN UNDER 6 YEARS
39.4/ 100
METRIC RATING
186th/ 347
METRIC RANK
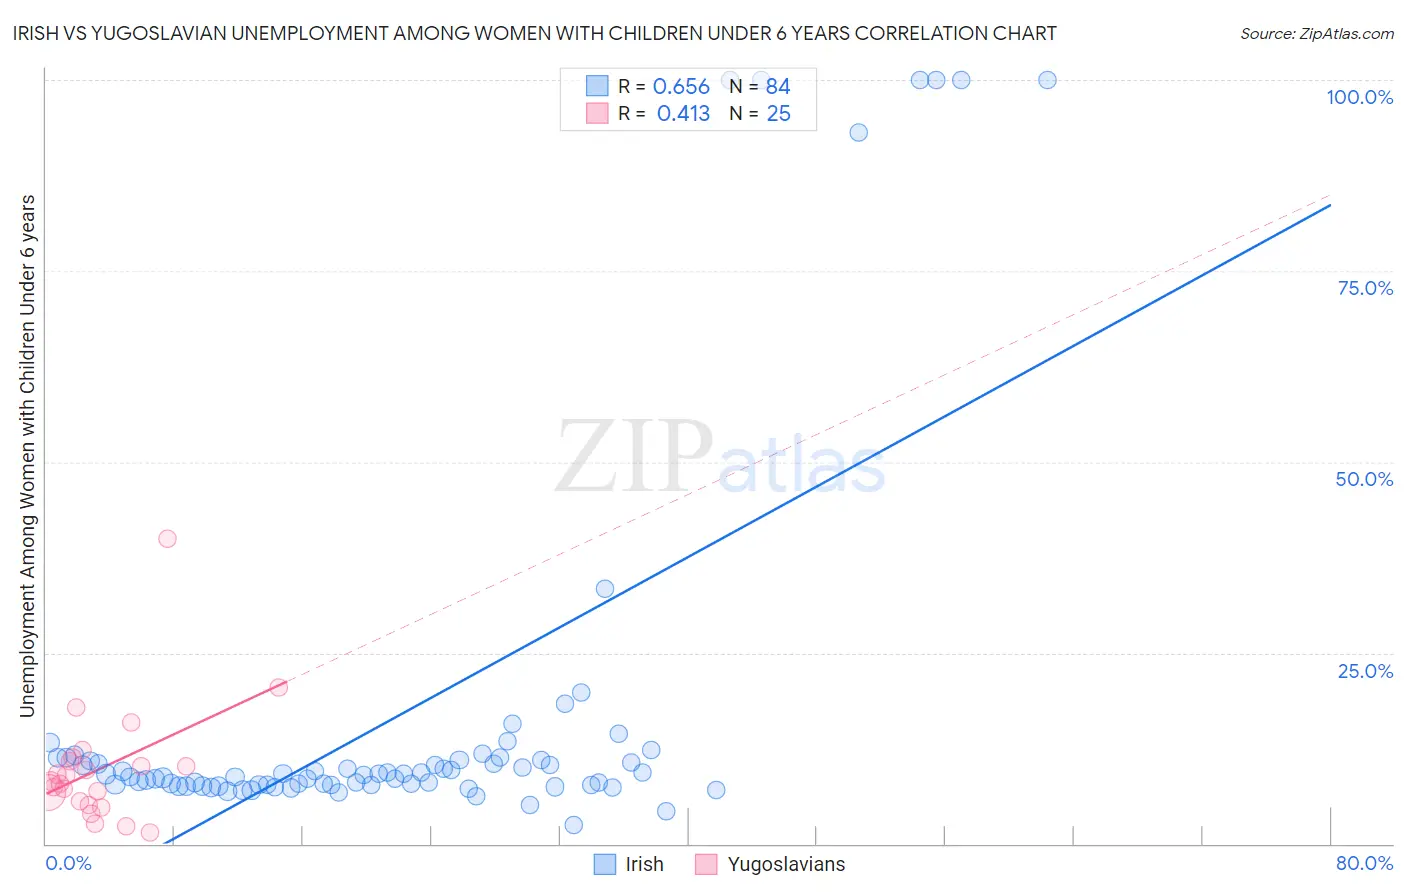
Irish vs Yugoslavian Unemployment Among Women with Children Under 6 years Correlation Chart
The statistical analysis conducted on geographies consisting of 378,985,462 people shows a significant positive correlation between the proportion of Irish and unemployment rate among women with children under the age of 6 in the United States with a correlation coefficient (R) of 0.656 and weighted average of 8.1%. Similarly, the statistical analysis conducted on geographies consisting of 225,026,278 people shows a moderate positive correlation between the proportion of Yugoslavians and unemployment rate among women with children under the age of 6 in the United States with a correlation coefficient (R) of 0.413 and weighted average of 7.7%, a difference of 5.2%.
Unemployment Among Women with Children Under 6 years Correlation Summary
| Measurement | Irish | Yugoslavian |
| Minimum | 2.5% | 1.4% |
| Maximum | 100.0% | 40.0% |
| Range | 97.5% | 38.6% |
| Mean | 16.9% | 9.9% |
| Median | 9.1% | 8.2% |
| Interquartile 25% (IQ1) | 7.7% | 5.3% |
| Interquartile 75% (IQ3) | 11.0% | 11.0% |
| Interquartile Range (IQR) | 3.3% | 5.7% |
| Standard Deviation (Sample) | 25.2% | 7.8% |
| Standard Deviation (Population) | 25.0% | 7.6% |
Similar Demographics by Unemployment Among Women with Children Under 6 years
Demographics Similar to Irish by Unemployment Among Women with Children Under 6 years
In terms of unemployment among women with children under 6 years, the demographic groups most similar to Irish are Immigrants from El Salvador (8.1%, a difference of 0.070%), Liberian (8.1%, a difference of 0.10%), Dutch (8.1%, a difference of 0.16%), Immigrants from Middle Africa (8.1%, a difference of 0.26%), and Immigrants from Costa Rica (8.0%, a difference of 0.65%).
| Demographics | Rating | Rank | Unemployment Among Women with Children Under 6 years |
| Welsh | 5.0 /100 | #232 | Tragic 8.0% |
| Immigrants | Trinidad and Tobago | 4.8 /100 | #233 | Tragic 8.0% |
| Kiowa | 4.4 /100 | #234 | Tragic 8.0% |
| Comanche | 4.3 /100 | #235 | Tragic 8.0% |
| Immigrants | Barbados | 4.2 /100 | #236 | Tragic 8.0% |
| Immigrants | Costa Rica | 4.1 /100 | #237 | Tragic 8.0% |
| Immigrants | Middle Africa | 3.2 /100 | #238 | Tragic 8.1% |
| Irish | 2.7 /100 | #239 | Tragic 8.1% |
| Immigrants | El Salvador | 2.6 /100 | #240 | Tragic 8.1% |
| Liberians | 2.6 /100 | #241 | Tragic 8.1% |
| Dutch | 2.5 /100 | #242 | Tragic 8.1% |
| Hawaiians | 1.8 /100 | #243 | Tragic 8.2% |
| French | 1.7 /100 | #244 | Tragic 8.2% |
| Native Hawaiians | 1.7 /100 | #245 | Tragic 8.2% |
| Central Americans | 1.4 /100 | #246 | Tragic 8.2% |
Demographics Similar to Yugoslavians by Unemployment Among Women with Children Under 6 years
In terms of unemployment among women with children under 6 years, the demographic groups most similar to Yugoslavians are Spanish American (7.7%, a difference of 0.020%), Immigrants from Thailand (7.7%, a difference of 0.060%), Czechoslovakian (7.7%, a difference of 0.060%), Indonesian (7.7%, a difference of 0.080%), and Sierra Leonean (7.7%, a difference of 0.24%).
| Demographics | Rating | Rank | Unemployment Among Women with Children Under 6 years |
| Immigrants | Western Europe | 44.9 /100 | #179 | Average 7.7% |
| Immigrants | Uruguay | 44.5 /100 | #180 | Average 7.7% |
| Brazilians | 43.9 /100 | #181 | Average 7.7% |
| Nepalese | 43.5 /100 | #182 | Average 7.7% |
| Sierra Leoneans | 42.9 /100 | #183 | Average 7.7% |
| Indonesians | 40.5 /100 | #184 | Average 7.7% |
| Spanish Americans | 39.7 /100 | #185 | Fair 7.7% |
| Yugoslavians | 39.4 /100 | #186 | Fair 7.7% |
| Immigrants | Thailand | 38.5 /100 | #187 | Fair 7.7% |
| Czechoslovakians | 38.4 /100 | #188 | Fair 7.7% |
| Immigrants | Panama | 35.7 /100 | #189 | Fair 7.7% |
| Immigrants | North Macedonia | 34.4 /100 | #190 | Fair 7.7% |
| Immigrants | Austria | 32.4 /100 | #191 | Fair 7.7% |
| Immigrants | Africa | 32.4 /100 | #192 | Fair 7.7% |
| Slavs | 32.4 /100 | #193 | Fair 7.7% |