Canadian vs Czech Unemployment Among Women with Children Under 6 years
COMPARE
Canadian
Czech
Unemployment Among Women with Children Under 6 years
Unemployment Among Women with Children Under 6 years Comparison
Canadians
Czechs
7.8%
UNEMPLOYMENT AMONG WOMEN WITH CHILDREN UNDER 6 YEARS
20.6/ 100
METRIC RATING
207th/ 347
METRIC RANK
7.6%
UNEMPLOYMENT AMONG WOMEN WITH CHILDREN UNDER 6 YEARS
59.8/ 100
METRIC RATING
170th/ 347
METRIC RANK
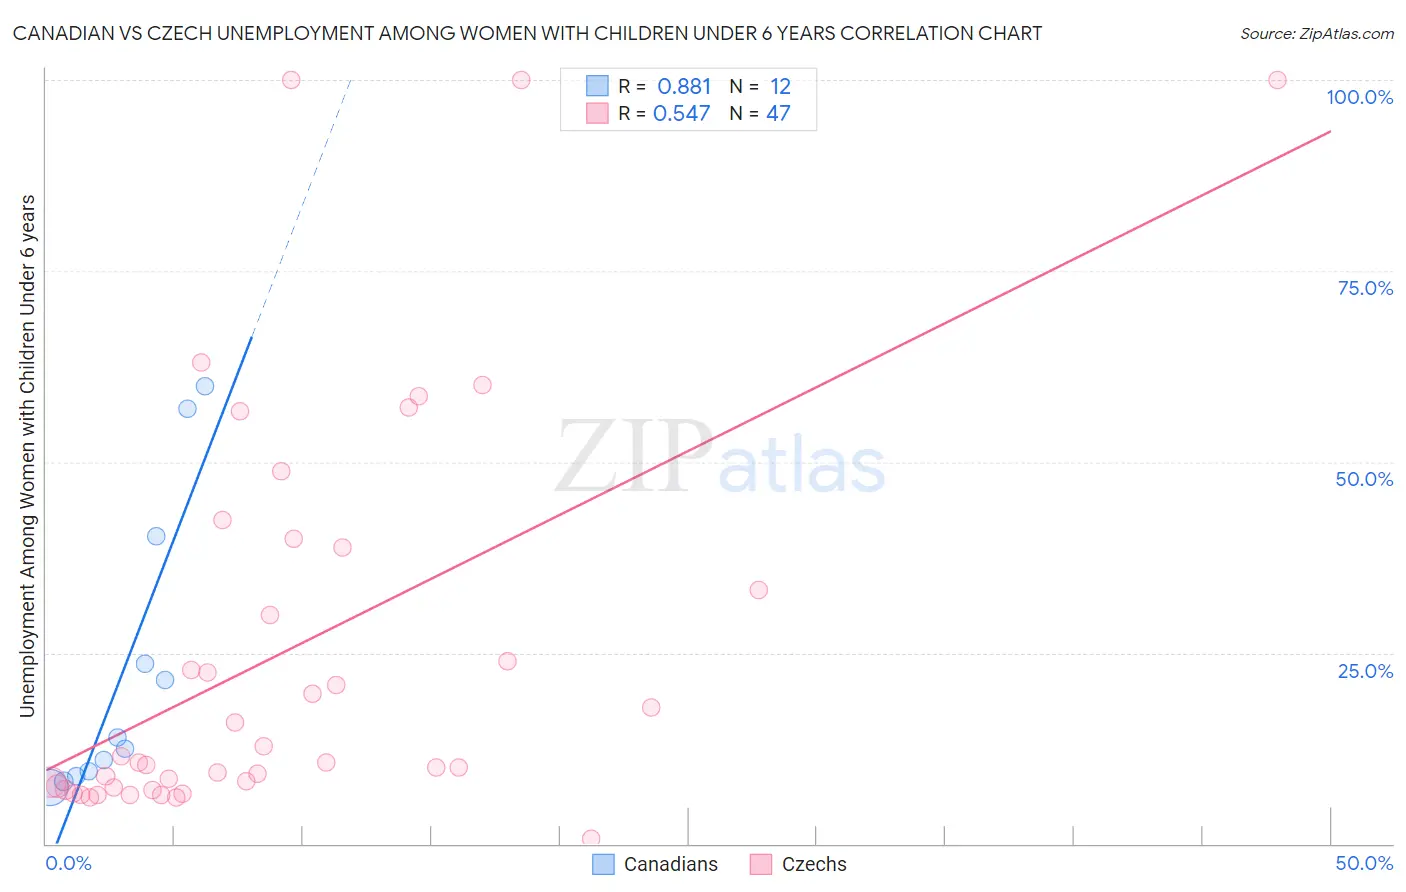
Canadian vs Czech Unemployment Among Women with Children Under 6 years Correlation Chart
The statistical analysis conducted on geographies consisting of 318,159,261 people shows a very strong positive correlation between the proportion of Canadians and unemployment rate among women with children under the age of 6 in the United States with a correlation coefficient (R) of 0.881 and weighted average of 7.8%. Similarly, the statistical analysis conducted on geographies consisting of 337,488,304 people shows a substantial positive correlation between the proportion of Czechs and unemployment rate among women with children under the age of 6 in the United States with a correlation coefficient (R) of 0.547 and weighted average of 7.6%, a difference of 2.9%.
Unemployment Among Women with Children Under 6 years Correlation Summary
| Measurement | Canadian | Czech |
| Minimum | 7.4% | 0.70% |
| Maximum | 59.9% | 100.0% |
| Range | 52.5% | 99.3% |
| Mean | 22.8% | 25.1% |
| Median | 13.2% | 10.7% |
| Interquartile 25% (IQ1) | 9.2% | 7.4% |
| Interquartile 75% (IQ3) | 31.9% | 38.8% |
| Interquartile Range (IQR) | 22.7% | 31.4% |
| Standard Deviation (Sample) | 19.1% | 26.3% |
| Standard Deviation (Population) | 18.3% | 26.1% |
Similar Demographics by Unemployment Among Women with Children Under 6 years
Demographics Similar to Canadians by Unemployment Among Women with Children Under 6 years
In terms of unemployment among women with children under 6 years, the demographic groups most similar to Canadians are Hungarian (7.8%, a difference of 0.060%), Immigrants (7.8%, a difference of 0.070%), Lebanese (7.8%, a difference of 0.15%), Immigrants from Syria (7.8%, a difference of 0.18%), and Spaniard (7.8%, a difference of 0.26%).
| Demographics | Rating | Rank | Unemployment Among Women with Children Under 6 years |
| Guamanians/Chamorros | 25.5 /100 | #200 | Fair 7.8% |
| Basques | 24.7 /100 | #201 | Fair 7.8% |
| Sudanese | 23.5 /100 | #202 | Fair 7.8% |
| Spaniards | 23.3 /100 | #203 | Fair 7.8% |
| Lebanese | 22.2 /100 | #204 | Fair 7.8% |
| Immigrants | Immigrants | 21.4 /100 | #205 | Fair 7.8% |
| Hungarians | 21.2 /100 | #206 | Fair 7.8% |
| Canadians | 20.6 /100 | #207 | Fair 7.8% |
| Immigrants | Syria | 18.9 /100 | #208 | Poor 7.8% |
| Costa Ricans | 17.6 /100 | #209 | Poor 7.8% |
| Poles | 16.0 /100 | #210 | Poor 7.9% |
| Immigrants | Ecuador | 14.9 /100 | #211 | Poor 7.9% |
| Swiss | 12.3 /100 | #212 | Poor 7.9% |
| Scottish | 11.4 /100 | #213 | Poor 7.9% |
| Spanish | 11.3 /100 | #214 | Poor 7.9% |
Demographics Similar to Czechs by Unemployment Among Women with Children Under 6 years
In terms of unemployment among women with children under 6 years, the demographic groups most similar to Czechs are Immigrants from Grenada (7.6%, a difference of 0.060%), Immigrants from Scotland (7.6%, a difference of 0.11%), Immigrants from Canada (7.6%, a difference of 0.12%), Immigrants from North America (7.6%, a difference of 0.14%), and Kenyan (7.6%, a difference of 0.19%).
| Demographics | Rating | Rank | Unemployment Among Women with Children Under 6 years |
| British | 66.3 /100 | #163 | Good 7.6% |
| Ugandans | 65.8 /100 | #164 | Good 7.6% |
| Immigrants | South America | 65.6 /100 | #165 | Good 7.6% |
| Belgians | 63.5 /100 | #166 | Good 7.6% |
| Kenyans | 62.5 /100 | #167 | Good 7.6% |
| Immigrants | Canada | 61.6 /100 | #168 | Good 7.6% |
| Immigrants | Scotland | 61.3 /100 | #169 | Good 7.6% |
| Czechs | 59.8 /100 | #170 | Average 7.6% |
| Immigrants | Grenada | 59.0 /100 | #171 | Average 7.6% |
| Immigrants | North America | 57.7 /100 | #172 | Average 7.6% |
| Cree | 51.6 /100 | #173 | Average 7.6% |
| Immigrants | Laos | 50.0 /100 | #174 | Average 7.6% |
| Panamanians | 49.6 /100 | #175 | Average 7.6% |
| Puget Sound Salish | 47.7 /100 | #176 | Average 7.7% |
| Austrians | 46.0 /100 | #177 | Average 7.7% |