Immigrants from Uzbekistan vs Apache Male Unemployment
COMPARE
Immigrants from Uzbekistan
Apache
Male Unemployment
Male Unemployment Comparison
Immigrants from Uzbekistan
Apache
6.0%
MALE UNEMPLOYMENT
0.0/ 100
METRIC RATING
272nd/ 347
METRIC RANK
8.6%
MALE UNEMPLOYMENT
0.0/ 100
METRIC RATING
338th/ 347
METRIC RANK
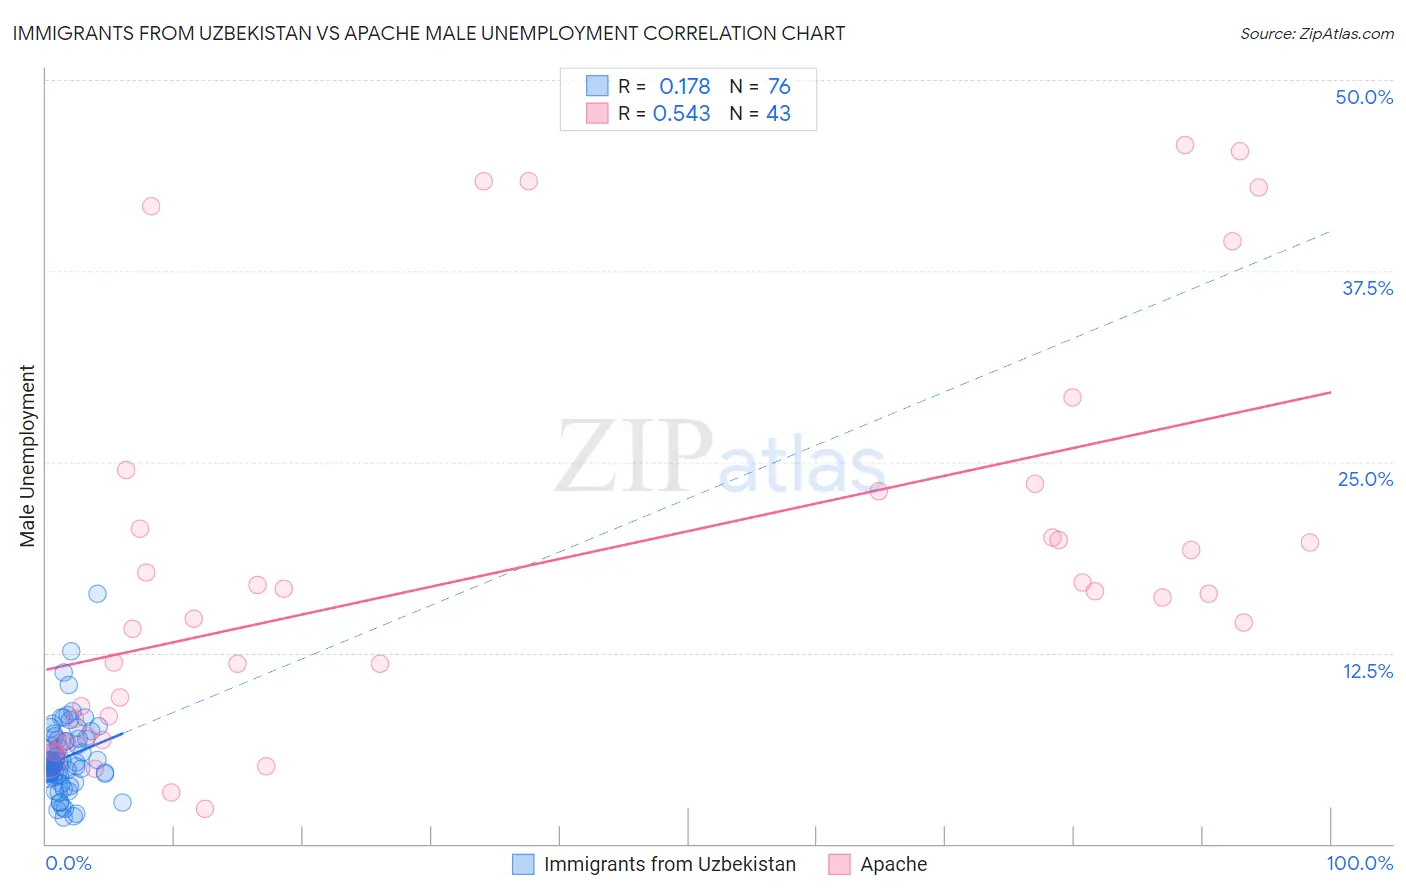
Immigrants from Uzbekistan vs Apache Male Unemployment Correlation Chart
The statistical analysis conducted on geographies consisting of 118,561,665 people shows a poor positive correlation between the proportion of Immigrants from Uzbekistan and unemployment rate among males in the United States with a correlation coefficient (R) of 0.178 and weighted average of 6.0%. Similarly, the statistical analysis conducted on geographies consisting of 230,425,231 people shows a substantial positive correlation between the proportion of Apache and unemployment rate among males in the United States with a correlation coefficient (R) of 0.543 and weighted average of 8.6%, a difference of 43.3%.
Male Unemployment Correlation Summary
| Measurement | Immigrants from Uzbekistan | Apache |
| Minimum | 1.7% | 2.3% |
| Maximum | 16.4% | 45.7% |
| Range | 14.7% | 43.4% |
| Mean | 5.7% | 18.3% |
| Median | 5.3% | 16.4% |
| Interquartile 25% (IQ1) | 4.5% | 8.2% |
| Interquartile 75% (IQ3) | 6.8% | 23.1% |
| Interquartile Range (IQR) | 2.3% | 14.9% |
| Standard Deviation (Sample) | 2.4% | 12.7% |
| Standard Deviation (Population) | 2.4% | 12.6% |
Similar Demographics by Male Unemployment
Demographics Similar to Immigrants from Uzbekistan by Male Unemployment
In terms of male unemployment, the demographic groups most similar to Immigrants from Uzbekistan are Armenian (6.0%, a difference of 0.010%), Immigrants from Sierra Leone (6.0%, a difference of 0.18%), Blackfeet (6.0%, a difference of 0.23%), Menominee (6.0%, a difference of 0.34%), and Tlingit-Haida (6.0%, a difference of 0.43%).
| Demographics | Rating | Rank | Male Unemployment |
| French American Indians | 0.0 /100 | #265 | Tragic 5.9% |
| Bahamians | 0.0 /100 | #266 | Tragic 5.9% |
| Nigerians | 0.0 /100 | #267 | Tragic 5.9% |
| Bermudans | 0.0 /100 | #268 | Tragic 5.9% |
| Immigrants | Nigeria | 0.0 /100 | #269 | Tragic 6.0% |
| Sub-Saharan Africans | 0.0 /100 | #270 | Tragic 6.0% |
| Blackfeet | 0.0 /100 | #271 | Tragic 6.0% |
| Immigrants | Uzbekistan | 0.0 /100 | #272 | Tragic 6.0% |
| Armenians | 0.0 /100 | #273 | Tragic 6.0% |
| Immigrants | Sierra Leone | 0.0 /100 | #274 | Tragic 6.0% |
| Menominee | 0.0 /100 | #275 | Tragic 6.0% |
| Tlingit-Haida | 0.0 /100 | #276 | Tragic 6.0% |
| Immigrants | Liberia | 0.0 /100 | #277 | Tragic 6.1% |
| Immigrants | Fiji | 0.0 /100 | #278 | Tragic 6.1% |
| Ghanaians | 0.0 /100 | #279 | Tragic 6.1% |
Demographics Similar to Apache by Male Unemployment
In terms of male unemployment, the demographic groups most similar to Apache are Puerto Rican (8.6%, a difference of 0.15%), Yuman (8.6%, a difference of 0.23%), Pueblo (8.5%, a difference of 1.6%), Tsimshian (8.5%, a difference of 1.7%), and Sioux (8.4%, a difference of 2.6%).
| Demographics | Rating | Rank | Male Unemployment |
| Alaska Natives | 0.0 /100 | #331 | Tragic 8.1% |
| Pima | 0.0 /100 | #332 | Tragic 8.3% |
| Sioux | 0.0 /100 | #333 | Tragic 8.4% |
| Tsimshian | 0.0 /100 | #334 | Tragic 8.5% |
| Pueblo | 0.0 /100 | #335 | Tragic 8.5% |
| Yuman | 0.0 /100 | #336 | Tragic 8.6% |
| Puerto Ricans | 0.0 /100 | #337 | Tragic 8.6% |
| Apache | 0.0 /100 | #338 | Tragic 8.6% |
| Cheyenne | 0.0 /100 | #339 | Tragic 9.8% |
| Alaskan Athabascans | 0.0 /100 | #340 | Tragic 9.8% |
| Navajo | 0.0 /100 | #341 | Tragic 9.8% |
| Tohono O'odham | 0.0 /100 | #342 | Tragic 10.2% |
| Crow | 0.0 /100 | #343 | Tragic 10.6% |
| Hopi | 0.0 /100 | #344 | Tragic 10.8% |
| Arapaho | 0.0 /100 | #345 | Tragic 11.0% |