Immigrants from Uzbekistan vs Australian Male Unemployment
COMPARE
Immigrants from Uzbekistan
Australian
Male Unemployment
Male Unemployment Comparison
Immigrants from Uzbekistan
Australians
6.0%
MALE UNEMPLOYMENT
0.0/ 100
METRIC RATING
272nd/ 347
METRIC RANK
5.0%
MALE UNEMPLOYMENT
97.4/ 100
METRIC RATING
68th/ 347
METRIC RANK
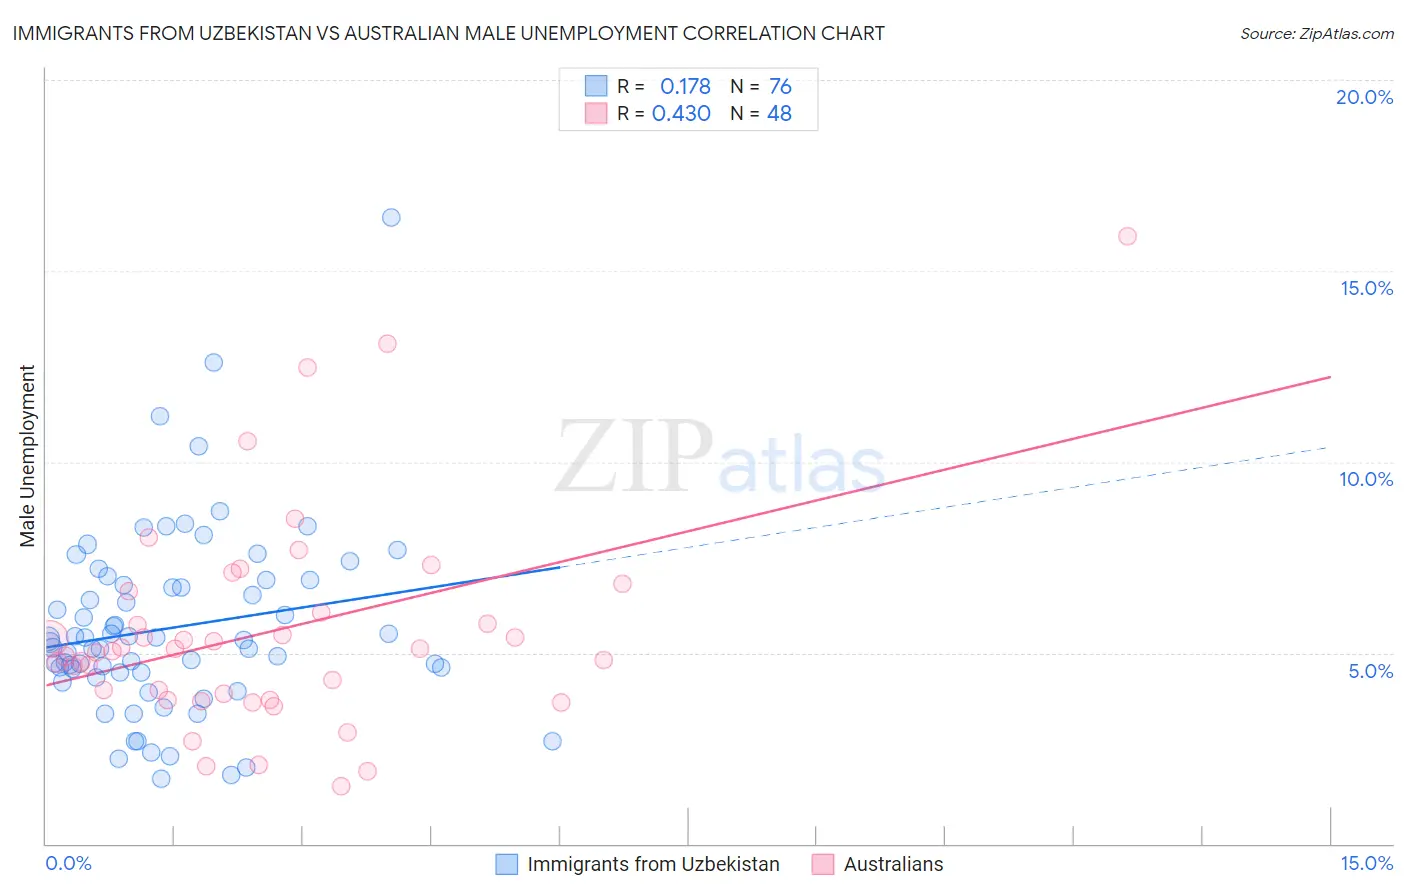
Immigrants from Uzbekistan vs Australian Male Unemployment Correlation Chart
The statistical analysis conducted on geographies consisting of 118,561,665 people shows a poor positive correlation between the proportion of Immigrants from Uzbekistan and unemployment rate among males in the United States with a correlation coefficient (R) of 0.178 and weighted average of 6.0%. Similarly, the statistical analysis conducted on geographies consisting of 223,647,847 people shows a moderate positive correlation between the proportion of Australians and unemployment rate among males in the United States with a correlation coefficient (R) of 0.430 and weighted average of 5.0%, a difference of 19.8%.
Male Unemployment Correlation Summary
| Measurement | Immigrants from Uzbekistan | Australian |
| Minimum | 1.7% | 1.5% |
| Maximum | 16.4% | 15.9% |
| Range | 14.7% | 14.4% |
| Mean | 5.7% | 5.6% |
| Median | 5.3% | 5.1% |
| Interquartile 25% (IQ1) | 4.5% | 3.8% |
| Interquartile 75% (IQ3) | 6.8% | 6.3% |
| Interquartile Range (IQR) | 2.3% | 2.5% |
| Standard Deviation (Sample) | 2.4% | 2.8% |
| Standard Deviation (Population) | 2.4% | 2.8% |
Similar Demographics by Male Unemployment
Demographics Similar to Immigrants from Uzbekistan by Male Unemployment
In terms of male unemployment, the demographic groups most similar to Immigrants from Uzbekistan are Armenian (6.0%, a difference of 0.010%), Immigrants from Sierra Leone (6.0%, a difference of 0.18%), Blackfeet (6.0%, a difference of 0.23%), Menominee (6.0%, a difference of 0.34%), and Tlingit-Haida (6.0%, a difference of 0.43%).
| Demographics | Rating | Rank | Male Unemployment |
| French American Indians | 0.0 /100 | #265 | Tragic 5.9% |
| Bahamians | 0.0 /100 | #266 | Tragic 5.9% |
| Nigerians | 0.0 /100 | #267 | Tragic 5.9% |
| Bermudans | 0.0 /100 | #268 | Tragic 5.9% |
| Immigrants | Nigeria | 0.0 /100 | #269 | Tragic 6.0% |
| Sub-Saharan Africans | 0.0 /100 | #270 | Tragic 6.0% |
| Blackfeet | 0.0 /100 | #271 | Tragic 6.0% |
| Immigrants | Uzbekistan | 0.0 /100 | #272 | Tragic 6.0% |
| Armenians | 0.0 /100 | #273 | Tragic 6.0% |
| Immigrants | Sierra Leone | 0.0 /100 | #274 | Tragic 6.0% |
| Menominee | 0.0 /100 | #275 | Tragic 6.0% |
| Tlingit-Haida | 0.0 /100 | #276 | Tragic 6.0% |
| Immigrants | Liberia | 0.0 /100 | #277 | Tragic 6.1% |
| Immigrants | Fiji | 0.0 /100 | #278 | Tragic 6.1% |
| Ghanaians | 0.0 /100 | #279 | Tragic 6.1% |
Demographics Similar to Australians by Male Unemployment
In terms of male unemployment, the demographic groups most similar to Australians are Immigrants from Canada (5.0%, a difference of 0.010%), Finnish (5.0%, a difference of 0.030%), Immigrants from Sweden (5.0%, a difference of 0.030%), White/Caucasian (5.0%, a difference of 0.080%), and New Zealander (5.0%, a difference of 0.10%).
| Demographics | Rating | Rank | Male Unemployment |
| Cambodians | 98.1 /100 | #61 | Exceptional 5.0% |
| Basques | 97.9 /100 | #62 | Exceptional 5.0% |
| Eastern Europeans | 97.9 /100 | #63 | Exceptional 5.0% |
| Celtics | 97.8 /100 | #64 | Exceptional 5.0% |
| Icelanders | 97.6 /100 | #65 | Exceptional 5.0% |
| Finns | 97.5 /100 | #66 | Exceptional 5.0% |
| Immigrants | Canada | 97.5 /100 | #67 | Exceptional 5.0% |
| Australians | 97.4 /100 | #68 | Exceptional 5.0% |
| Immigrants | Sweden | 97.4 /100 | #69 | Exceptional 5.0% |
| Whites/Caucasians | 97.3 /100 | #70 | Exceptional 5.0% |
| New Zealanders | 97.3 /100 | #71 | Exceptional 5.0% |
| Immigrants | South Africa | 97.1 /100 | #72 | Exceptional 5.0% |
| Greeks | 97.0 /100 | #73 | Exceptional 5.0% |
| Immigrants | North America | 96.9 /100 | #74 | Exceptional 5.0% |
| Assyrians/Chaldeans/Syriacs | 96.9 /100 | #75 | Exceptional 5.0% |