Immigrants from Uzbekistan vs Assyrian/Chaldean/Syriac Male Unemployment
COMPARE
Immigrants from Uzbekistan
Assyrian/Chaldean/Syriac
Male Unemployment
Male Unemployment Comparison
Immigrants from Uzbekistan
Assyrians/Chaldeans/Syriacs
6.0%
MALE UNEMPLOYMENT
0.0/ 100
METRIC RATING
272nd/ 347
METRIC RANK
5.0%
MALE UNEMPLOYMENT
96.9/ 100
METRIC RATING
75th/ 347
METRIC RANK
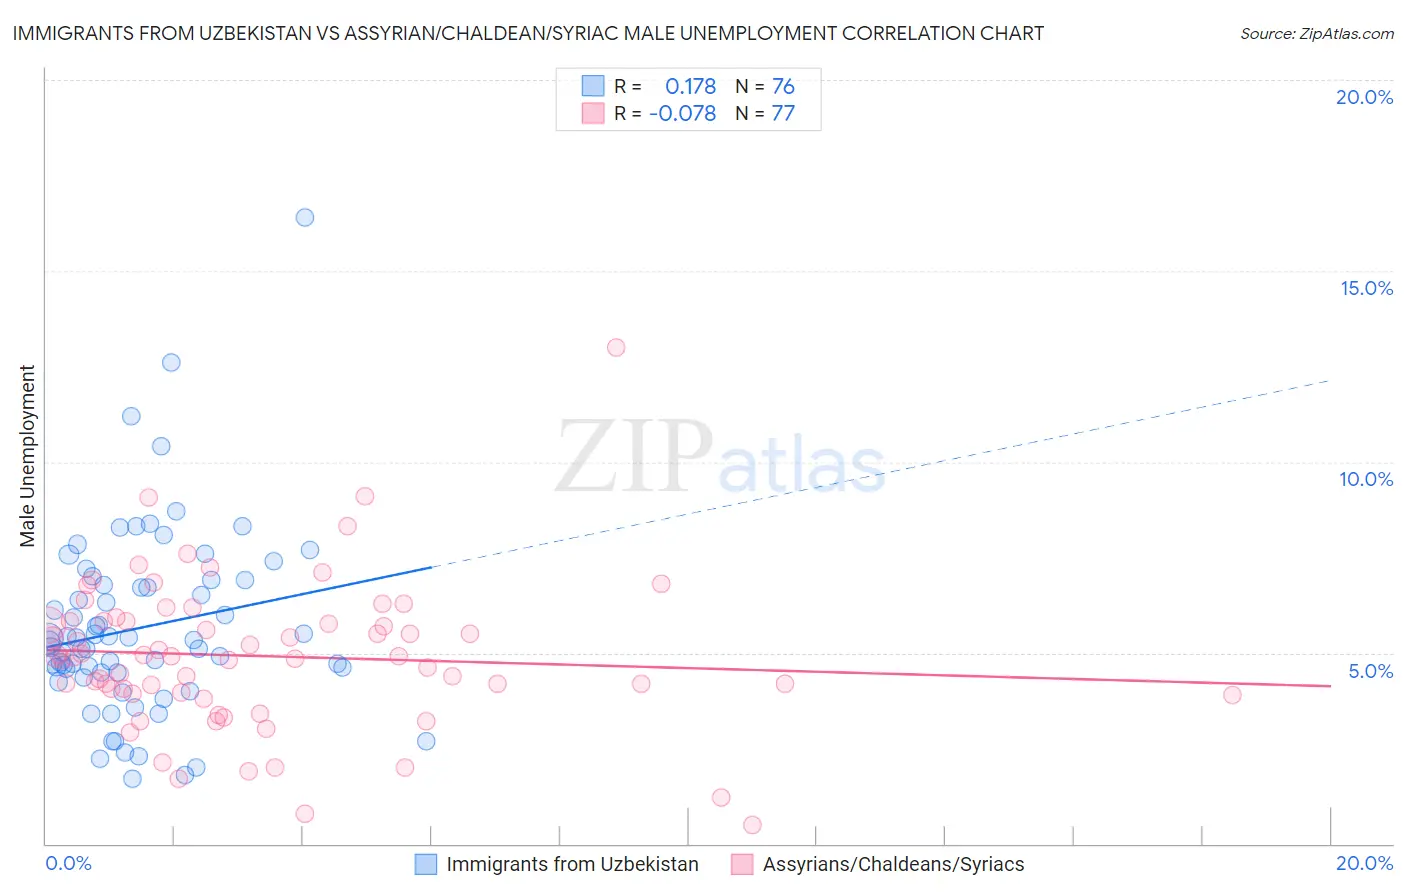
Immigrants from Uzbekistan vs Assyrian/Chaldean/Syriac Male Unemployment Correlation Chart
The statistical analysis conducted on geographies consisting of 118,561,665 people shows a poor positive correlation between the proportion of Immigrants from Uzbekistan and unemployment rate among males in the United States with a correlation coefficient (R) of 0.178 and weighted average of 6.0%. Similarly, the statistical analysis conducted on geographies consisting of 110,205,366 people shows a slight negative correlation between the proportion of Assyrians/Chaldeans/Syriacs and unemployment rate among males in the United States with a correlation coefficient (R) of -0.078 and weighted average of 5.0%, a difference of 19.4%.
Male Unemployment Correlation Summary
| Measurement | Immigrants from Uzbekistan | Assyrian/Chaldean/Syriac |
| Minimum | 1.7% | 0.50% |
| Maximum | 16.4% | 13.0% |
| Range | 14.7% | 12.5% |
| Mean | 5.7% | 4.9% |
| Median | 5.3% | 4.9% |
| Interquartile 25% (IQ1) | 4.5% | 3.9% |
| Interquartile 75% (IQ3) | 6.8% | 5.8% |
| Interquartile Range (IQR) | 2.3% | 1.9% |
| Standard Deviation (Sample) | 2.4% | 2.0% |
| Standard Deviation (Population) | 2.4% | 2.0% |
Similar Demographics by Male Unemployment
Demographics Similar to Immigrants from Uzbekistan by Male Unemployment
In terms of male unemployment, the demographic groups most similar to Immigrants from Uzbekistan are Armenian (6.0%, a difference of 0.010%), Immigrants from Sierra Leone (6.0%, a difference of 0.18%), Blackfeet (6.0%, a difference of 0.23%), Menominee (6.0%, a difference of 0.34%), and Tlingit-Haida (6.0%, a difference of 0.43%).
| Demographics | Rating | Rank | Male Unemployment |
| French American Indians | 0.0 /100 | #265 | Tragic 5.9% |
| Bahamians | 0.0 /100 | #266 | Tragic 5.9% |
| Nigerians | 0.0 /100 | #267 | Tragic 5.9% |
| Bermudans | 0.0 /100 | #268 | Tragic 5.9% |
| Immigrants | Nigeria | 0.0 /100 | #269 | Tragic 6.0% |
| Sub-Saharan Africans | 0.0 /100 | #270 | Tragic 6.0% |
| Blackfeet | 0.0 /100 | #271 | Tragic 6.0% |
| Immigrants | Uzbekistan | 0.0 /100 | #272 | Tragic 6.0% |
| Armenians | 0.0 /100 | #273 | Tragic 6.0% |
| Immigrants | Sierra Leone | 0.0 /100 | #274 | Tragic 6.0% |
| Menominee | 0.0 /100 | #275 | Tragic 6.0% |
| Tlingit-Haida | 0.0 /100 | #276 | Tragic 6.0% |
| Immigrants | Liberia | 0.0 /100 | #277 | Tragic 6.1% |
| Immigrants | Fiji | 0.0 /100 | #278 | Tragic 6.1% |
| Ghanaians | 0.0 /100 | #279 | Tragic 6.1% |
Demographics Similar to Assyrians/Chaldeans/Syriacs by Male Unemployment
In terms of male unemployment, the demographic groups most similar to Assyrians/Chaldeans/Syriacs are Immigrants from North America (5.0%, a difference of 0.030%), Greek (5.0%, a difference of 0.060%), Immigrants from South Africa (5.0%, a difference of 0.14%), Immigrants from Sudan (5.0%, a difference of 0.16%), and Iranian (5.0%, a difference of 0.21%).
| Demographics | Rating | Rank | Male Unemployment |
| Australians | 97.4 /100 | #68 | Exceptional 5.0% |
| Immigrants | Sweden | 97.4 /100 | #69 | Exceptional 5.0% |
| Whites/Caucasians | 97.3 /100 | #70 | Exceptional 5.0% |
| New Zealanders | 97.3 /100 | #71 | Exceptional 5.0% |
| Immigrants | South Africa | 97.1 /100 | #72 | Exceptional 5.0% |
| Greeks | 97.0 /100 | #73 | Exceptional 5.0% |
| Immigrants | North America | 96.9 /100 | #74 | Exceptional 5.0% |
| Assyrians/Chaldeans/Syriacs | 96.9 /100 | #75 | Exceptional 5.0% |
| Immigrants | Sudan | 96.5 /100 | #76 | Exceptional 5.0% |
| Iranians | 96.4 /100 | #77 | Exceptional 5.0% |
| Immigrants | Northern Europe | 96.4 /100 | #78 | Exceptional 5.0% |
| South Africans | 96.4 /100 | #79 | Exceptional 5.0% |
| Argentineans | 96.2 /100 | #80 | Exceptional 5.0% |
| French | 96.2 /100 | #81 | Exceptional 5.0% |
| Chileans | 96.2 /100 | #82 | Exceptional 5.0% |