Immigrants from Uzbekistan vs Chinese Male Unemployment
COMPARE
Immigrants from Uzbekistan
Chinese
Male Unemployment
Male Unemployment Comparison
Immigrants from Uzbekistan
Chinese
6.0%
MALE UNEMPLOYMENT
0.0/ 100
METRIC RATING
272nd/ 347
METRIC RANK
4.9%
MALE UNEMPLOYMENT
99.3/ 100
METRIC RATING
41st/ 347
METRIC RANK
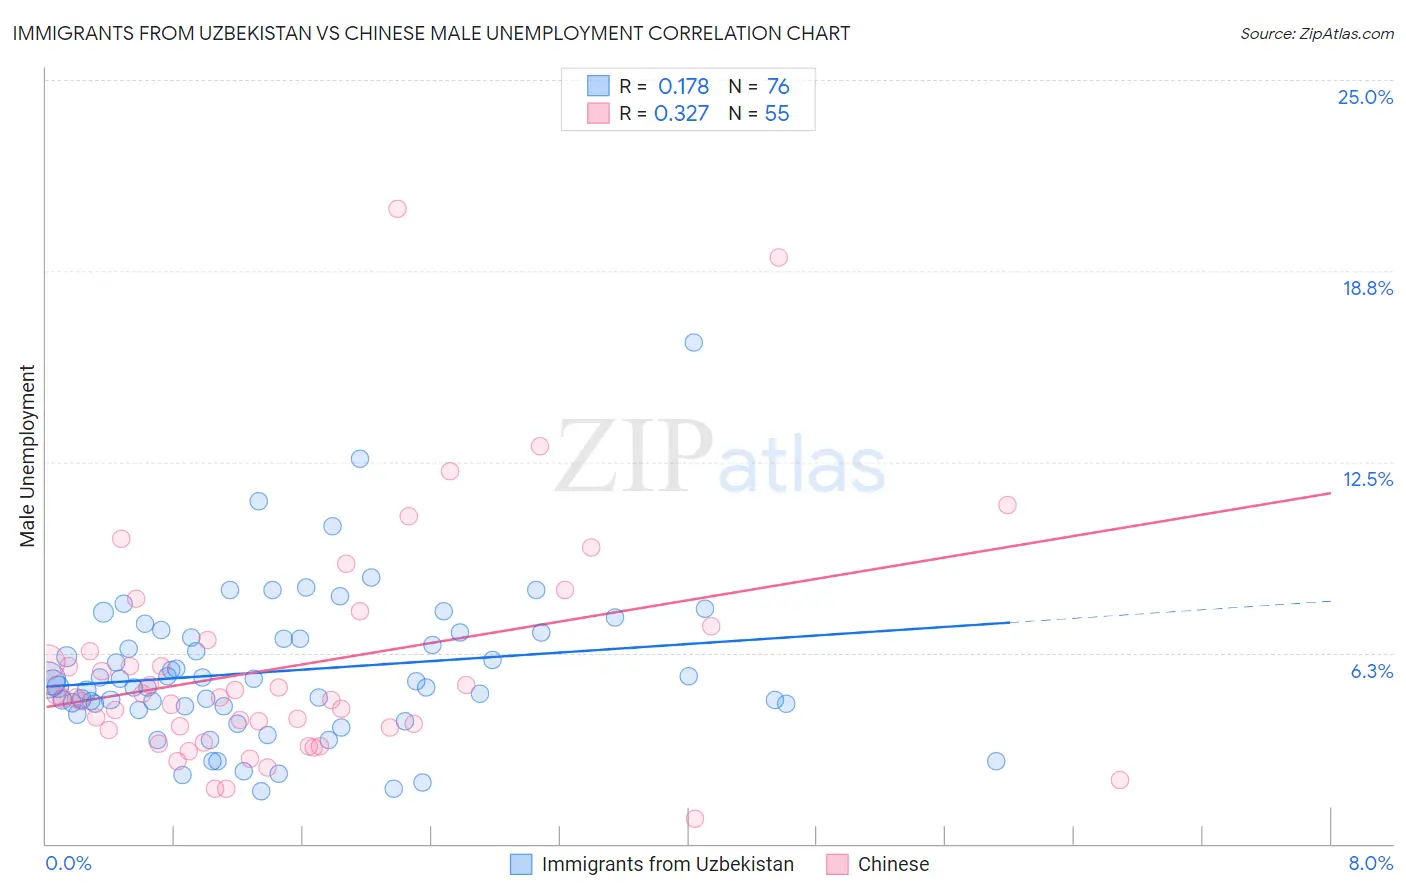
Immigrants from Uzbekistan vs Chinese Male Unemployment Correlation Chart
The statistical analysis conducted on geographies consisting of 118,561,665 people shows a poor positive correlation between the proportion of Immigrants from Uzbekistan and unemployment rate among males in the United States with a correlation coefficient (R) of 0.178 and weighted average of 6.0%. Similarly, the statistical analysis conducted on geographies consisting of 64,756,701 people shows a mild positive correlation between the proportion of Chinese and unemployment rate among males in the United States with a correlation coefficient (R) of 0.327 and weighted average of 4.9%, a difference of 22.1%.
Male Unemployment Correlation Summary
| Measurement | Immigrants from Uzbekistan | Chinese |
| Minimum | 1.7% | 0.80% |
| Maximum | 16.4% | 20.8% |
| Range | 14.7% | 20.0% |
| Mean | 5.7% | 5.8% |
| Median | 5.3% | 4.8% |
| Interquartile 25% (IQ1) | 4.5% | 3.7% |
| Interquartile 75% (IQ3) | 6.8% | 6.7% |
| Interquartile Range (IQR) | 2.3% | 2.9% |
| Standard Deviation (Sample) | 2.4% | 3.8% |
| Standard Deviation (Population) | 2.4% | 3.8% |
Similar Demographics by Male Unemployment
Demographics Similar to Immigrants from Uzbekistan by Male Unemployment
In terms of male unemployment, the demographic groups most similar to Immigrants from Uzbekistan are Armenian (6.0%, a difference of 0.010%), Immigrants from Sierra Leone (6.0%, a difference of 0.18%), Blackfeet (6.0%, a difference of 0.23%), Menominee (6.0%, a difference of 0.34%), and Tlingit-Haida (6.0%, a difference of 0.43%).
| Demographics | Rating | Rank | Male Unemployment |
| French American Indians | 0.0 /100 | #265 | Tragic 5.9% |
| Bahamians | 0.0 /100 | #266 | Tragic 5.9% |
| Nigerians | 0.0 /100 | #267 | Tragic 5.9% |
| Bermudans | 0.0 /100 | #268 | Tragic 5.9% |
| Immigrants | Nigeria | 0.0 /100 | #269 | Tragic 6.0% |
| Sub-Saharan Africans | 0.0 /100 | #270 | Tragic 6.0% |
| Blackfeet | 0.0 /100 | #271 | Tragic 6.0% |
| Immigrants | Uzbekistan | 0.0 /100 | #272 | Tragic 6.0% |
| Armenians | 0.0 /100 | #273 | Tragic 6.0% |
| Immigrants | Sierra Leone | 0.0 /100 | #274 | Tragic 6.0% |
| Menominee | 0.0 /100 | #275 | Tragic 6.0% |
| Tlingit-Haida | 0.0 /100 | #276 | Tragic 6.0% |
| Immigrants | Liberia | 0.0 /100 | #277 | Tragic 6.1% |
| Immigrants | Fiji | 0.0 /100 | #278 | Tragic 6.1% |
| Ghanaians | 0.0 /100 | #279 | Tragic 6.1% |
Demographics Similar to Chinese by Male Unemployment
In terms of male unemployment, the demographic groups most similar to Chinese are Immigrants from Belgium (4.9%, a difference of 0.020%), Northern European (4.9%, a difference of 0.080%), Immigrants from Japan (4.9%, a difference of 0.13%), Burmese (4.9%, a difference of 0.17%), and Immigrants from Bosnia and Herzegovina (4.9%, a difference of 0.24%).
| Demographics | Rating | Rank | Male Unemployment |
| Welsh | 99.7 /100 | #34 | Exceptional 4.8% |
| Paraguayans | 99.5 /100 | #35 | Exceptional 4.9% |
| Immigrants | Singapore | 99.4 /100 | #36 | Exceptional 4.9% |
| Scotch-Irish | 99.4 /100 | #37 | Exceptional 4.9% |
| Immigrants | Bosnia and Herzegovina | 99.4 /100 | #38 | Exceptional 4.9% |
| Burmese | 99.3 /100 | #39 | Exceptional 4.9% |
| Northern Europeans | 99.3 /100 | #40 | Exceptional 4.9% |
| Chinese | 99.3 /100 | #41 | Exceptional 4.9% |
| Immigrants | Belgium | 99.2 /100 | #42 | Exceptional 4.9% |
| Immigrants | Japan | 99.2 /100 | #43 | Exceptional 4.9% |
| Immigrants | Korea | 99.1 /100 | #44 | Exceptional 4.9% |
| Immigrants | Zimbabwe | 99.0 /100 | #45 | Exceptional 4.9% |
| Bhutanese | 98.9 /100 | #46 | Exceptional 4.9% |
| Austrians | 98.9 /100 | #47 | Exceptional 4.9% |
| Immigrants | Scotland | 98.9 /100 | #48 | Exceptional 4.9% |