Immigrants from Guyana vs Apache Male Unemployment
COMPARE
Immigrants from Guyana
Apache
Male Unemployment
Male Unemployment Comparison
Immigrants from Guyana
Apache
7.1%
MALE UNEMPLOYMENT
0.0/ 100
METRIC RATING
316th/ 347
METRIC RANK
8.6%
MALE UNEMPLOYMENT
0.0/ 100
METRIC RATING
338th/ 347
METRIC RANK
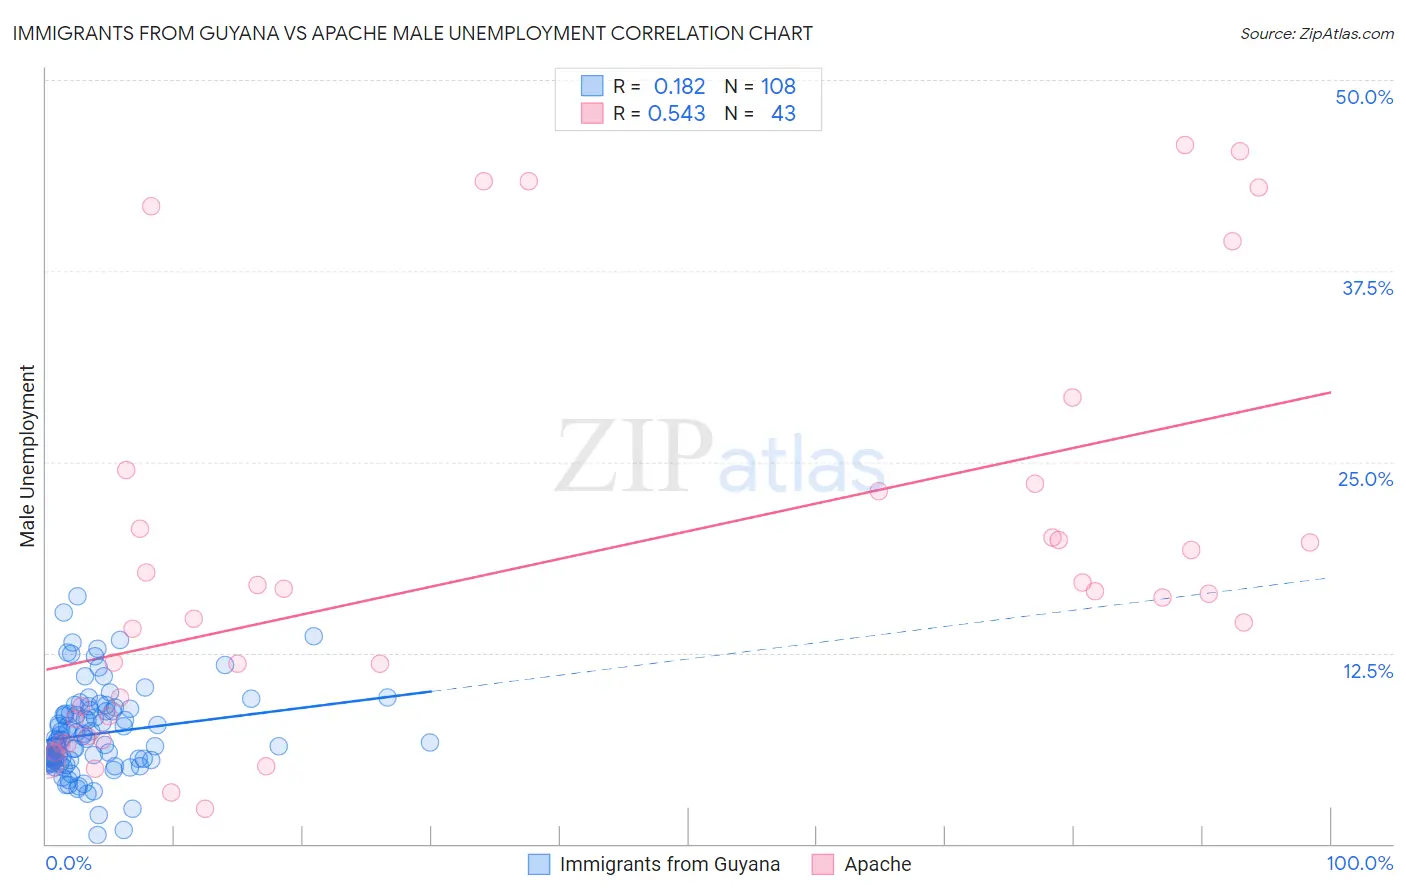
Immigrants from Guyana vs Apache Male Unemployment Correlation Chart
The statistical analysis conducted on geographies consisting of 183,427,886 people shows a poor positive correlation between the proportion of Immigrants from Guyana and unemployment rate among males in the United States with a correlation coefficient (R) of 0.182 and weighted average of 7.1%. Similarly, the statistical analysis conducted on geographies consisting of 230,425,231 people shows a substantial positive correlation between the proportion of Apache and unemployment rate among males in the United States with a correlation coefficient (R) of 0.543 and weighted average of 8.6%, a difference of 21.0%.
Male Unemployment Correlation Summary
| Measurement | Immigrants from Guyana | Apache |
| Minimum | 0.60% | 2.3% |
| Maximum | 16.2% | 45.7% |
| Range | 15.6% | 43.4% |
| Mean | 7.2% | 18.3% |
| Median | 6.7% | 16.4% |
| Interquartile 25% (IQ1) | 5.4% | 8.2% |
| Interquartile 75% (IQ3) | 8.7% | 23.1% |
| Interquartile Range (IQR) | 3.3% | 14.9% |
| Standard Deviation (Sample) | 2.8% | 12.7% |
| Standard Deviation (Population) | 2.8% | 12.6% |
Similar Demographics by Male Unemployment
Demographics Similar to Immigrants from Guyana by Male Unemployment
In terms of male unemployment, the demographic groups most similar to Immigrants from Guyana are Houma (7.1%, a difference of 0.030%), Guyanese (7.1%, a difference of 0.060%), Cape Verdean (7.1%, a difference of 0.12%), Immigrants from Barbados (7.1%, a difference of 0.24%), and Immigrants from Dominica (7.0%, a difference of 1.5%).
| Demographics | Rating | Rank | Male Unemployment |
| Barbadians | 0.0 /100 | #309 | Tragic 6.9% |
| Blacks/African Americans | 0.0 /100 | #310 | Tragic 6.9% |
| Immigrants | Armenia | 0.0 /100 | #311 | Tragic 6.9% |
| Lumbee | 0.0 /100 | #312 | Tragic 6.9% |
| Immigrants | Dominica | 0.0 /100 | #313 | Tragic 7.0% |
| Immigrants | Barbados | 0.0 /100 | #314 | Tragic 7.1% |
| Houma | 0.0 /100 | #315 | Tragic 7.1% |
| Immigrants | Guyana | 0.0 /100 | #316 | Tragic 7.1% |
| Guyanese | 0.0 /100 | #317 | Tragic 7.1% |
| Cape Verdeans | 0.0 /100 | #318 | Tragic 7.1% |
| British West Indians | 0.0 /100 | #319 | Tragic 7.3% |
| Colville | 0.0 /100 | #320 | Tragic 7.4% |
| Immigrants | St. Vincent and the Grenadines | 0.0 /100 | #321 | Tragic 7.5% |
| Immigrants | Cabo Verde | 0.0 /100 | #322 | Tragic 7.5% |
| Immigrants | Grenada | 0.0 /100 | #323 | Tragic 7.6% |
Demographics Similar to Apache by Male Unemployment
In terms of male unemployment, the demographic groups most similar to Apache are Puerto Rican (8.6%, a difference of 0.15%), Yuman (8.6%, a difference of 0.23%), Pueblo (8.5%, a difference of 1.6%), Tsimshian (8.5%, a difference of 1.7%), and Sioux (8.4%, a difference of 2.6%).
| Demographics | Rating | Rank | Male Unemployment |
| Alaska Natives | 0.0 /100 | #331 | Tragic 8.1% |
| Pima | 0.0 /100 | #332 | Tragic 8.3% |
| Sioux | 0.0 /100 | #333 | Tragic 8.4% |
| Tsimshian | 0.0 /100 | #334 | Tragic 8.5% |
| Pueblo | 0.0 /100 | #335 | Tragic 8.5% |
| Yuman | 0.0 /100 | #336 | Tragic 8.6% |
| Puerto Ricans | 0.0 /100 | #337 | Tragic 8.6% |
| Apache | 0.0 /100 | #338 | Tragic 8.6% |
| Cheyenne | 0.0 /100 | #339 | Tragic 9.8% |
| Alaskan Athabascans | 0.0 /100 | #340 | Tragic 9.8% |
| Navajo | 0.0 /100 | #341 | Tragic 9.8% |
| Tohono O'odham | 0.0 /100 | #342 | Tragic 10.2% |
| Crow | 0.0 /100 | #343 | Tragic 10.6% |
| Hopi | 0.0 /100 | #344 | Tragic 10.8% |
| Arapaho | 0.0 /100 | #345 | Tragic 11.0% |