Cajun vs Apache Male Unemployment
COMPARE
Cajun
Apache
Male Unemployment
Male Unemployment Comparison
Cajuns
Apache
5.8%
MALE UNEMPLOYMENT
0.1/ 100
METRIC RATING
259th/ 347
METRIC RANK
8.6%
MALE UNEMPLOYMENT
0.0/ 100
METRIC RATING
338th/ 347
METRIC RANK
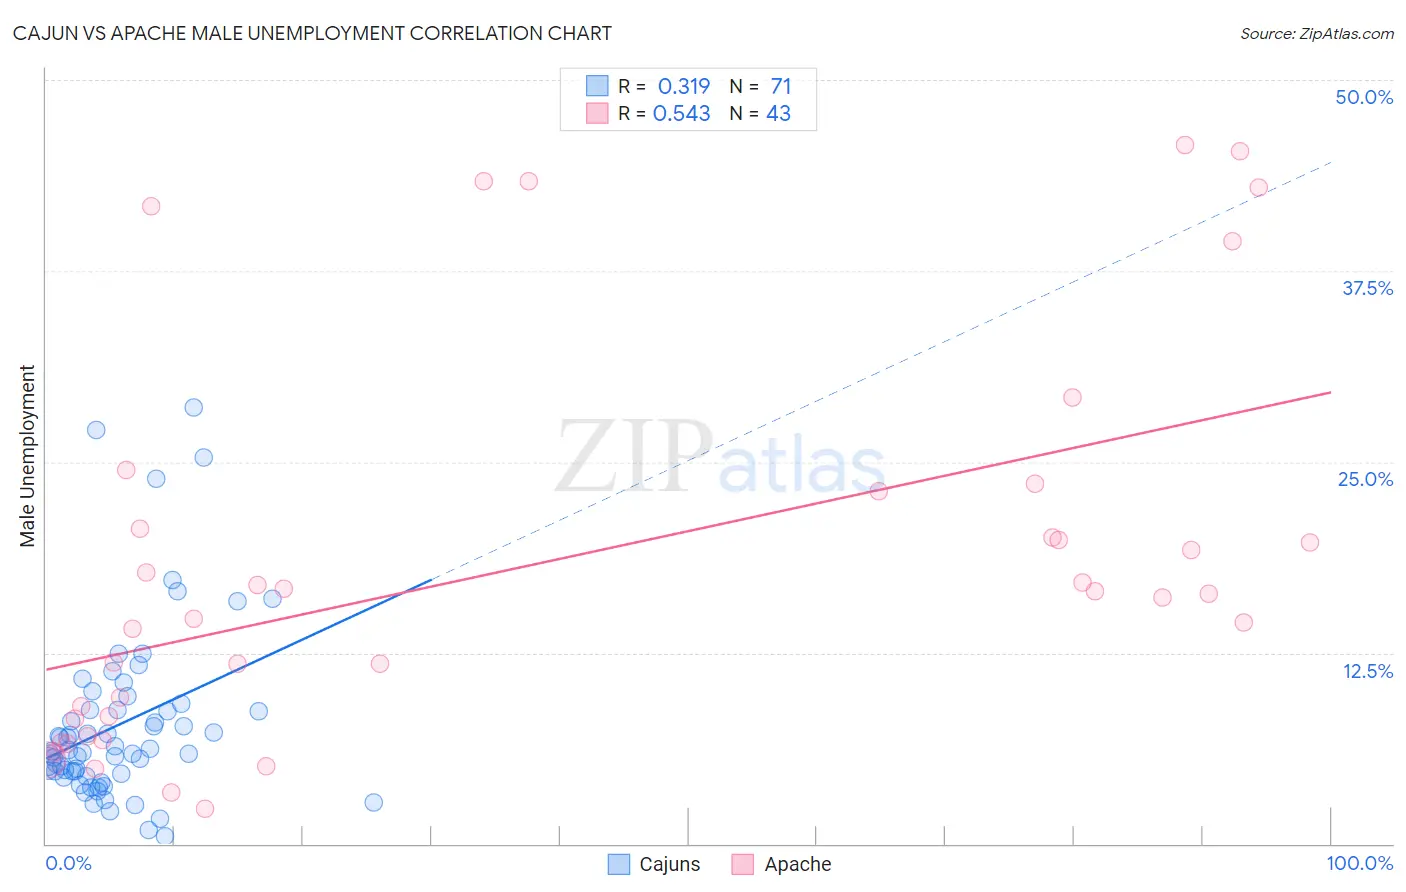
Cajun vs Apache Male Unemployment Correlation Chart
The statistical analysis conducted on geographies consisting of 149,208,256 people shows a mild positive correlation between the proportion of Cajuns and unemployment rate among males in the United States with a correlation coefficient (R) of 0.319 and weighted average of 5.8%. Similarly, the statistical analysis conducted on geographies consisting of 230,425,231 people shows a substantial positive correlation between the proportion of Apache and unemployment rate among males in the United States with a correlation coefficient (R) of 0.543 and weighted average of 8.6%, a difference of 47.8%.
Male Unemployment Correlation Summary
| Measurement | Cajun | Apache |
| Minimum | 0.50% | 2.3% |
| Maximum | 28.6% | 45.7% |
| Range | 28.1% | 43.4% |
| Mean | 7.8% | 18.3% |
| Median | 6.1% | 16.4% |
| Interquartile 25% (IQ1) | 4.6% | 8.2% |
| Interquartile 75% (IQ3) | 8.8% | 23.1% |
| Interquartile Range (IQR) | 4.2% | 14.9% |
| Standard Deviation (Sample) | 5.8% | 12.7% |
| Standard Deviation (Population) | 5.7% | 12.6% |
Similar Demographics by Male Unemployment
Demographics Similar to Cajuns by Male Unemployment
In terms of male unemployment, the demographic groups most similar to Cajuns are Immigrants from Central America (5.8%, a difference of 0.060%), Dutch West Indian (5.8%, a difference of 0.15%), Liberian (5.8%, a difference of 0.24%), Hispanic or Latino (5.8%, a difference of 0.29%), and Comanche (5.8%, a difference of 0.46%).
| Demographics | Rating | Rank | Male Unemployment |
| Mexicans | 0.2 /100 | #252 | Tragic 5.8% |
| Mexican American Indians | 0.2 /100 | #253 | Tragic 5.8% |
| Japanese | 0.2 /100 | #254 | Tragic 5.8% |
| Kiowa | 0.2 /100 | #255 | Tragic 5.8% |
| Comanche | 0.2 /100 | #256 | Tragic 5.8% |
| Hispanics or Latinos | 0.1 /100 | #257 | Tragic 5.8% |
| Dutch West Indians | 0.1 /100 | #258 | Tragic 5.8% |
| Cajuns | 0.1 /100 | #259 | Tragic 5.8% |
| Immigrants | Central America | 0.1 /100 | #260 | Tragic 5.8% |
| Liberians | 0.1 /100 | #261 | Tragic 5.8% |
| Immigrants | Portugal | 0.1 /100 | #262 | Tragic 5.9% |
| Immigrants | Latin America | 0.1 /100 | #263 | Tragic 5.9% |
| Immigrants | Mexico | 0.0 /100 | #264 | Tragic 5.9% |
| French American Indians | 0.0 /100 | #265 | Tragic 5.9% |
| Bahamians | 0.0 /100 | #266 | Tragic 5.9% |
Demographics Similar to Apache by Male Unemployment
In terms of male unemployment, the demographic groups most similar to Apache are Puerto Rican (8.6%, a difference of 0.15%), Yuman (8.6%, a difference of 0.23%), Pueblo (8.5%, a difference of 1.6%), Tsimshian (8.5%, a difference of 1.7%), and Sioux (8.4%, a difference of 2.6%).
| Demographics | Rating | Rank | Male Unemployment |
| Alaska Natives | 0.0 /100 | #331 | Tragic 8.1% |
| Pima | 0.0 /100 | #332 | Tragic 8.3% |
| Sioux | 0.0 /100 | #333 | Tragic 8.4% |
| Tsimshian | 0.0 /100 | #334 | Tragic 8.5% |
| Pueblo | 0.0 /100 | #335 | Tragic 8.5% |
| Yuman | 0.0 /100 | #336 | Tragic 8.6% |
| Puerto Ricans | 0.0 /100 | #337 | Tragic 8.6% |
| Apache | 0.0 /100 | #338 | Tragic 8.6% |
| Cheyenne | 0.0 /100 | #339 | Tragic 9.8% |
| Alaskan Athabascans | 0.0 /100 | #340 | Tragic 9.8% |
| Navajo | 0.0 /100 | #341 | Tragic 9.8% |
| Tohono O'odham | 0.0 /100 | #342 | Tragic 10.2% |
| Crow | 0.0 /100 | #343 | Tragic 10.6% |
| Hopi | 0.0 /100 | #344 | Tragic 10.8% |
| Arapaho | 0.0 /100 | #345 | Tragic 11.0% |