Egyptian vs Apache Male Unemployment
COMPARE
Egyptian
Apache
Male Unemployment
Male Unemployment Comparison
Egyptians
Apache
5.2%
MALE UNEMPLOYMENT
74.8/ 100
METRIC RATING
152nd/ 347
METRIC RANK
8.6%
MALE UNEMPLOYMENT
0.0/ 100
METRIC RATING
338th/ 347
METRIC RANK
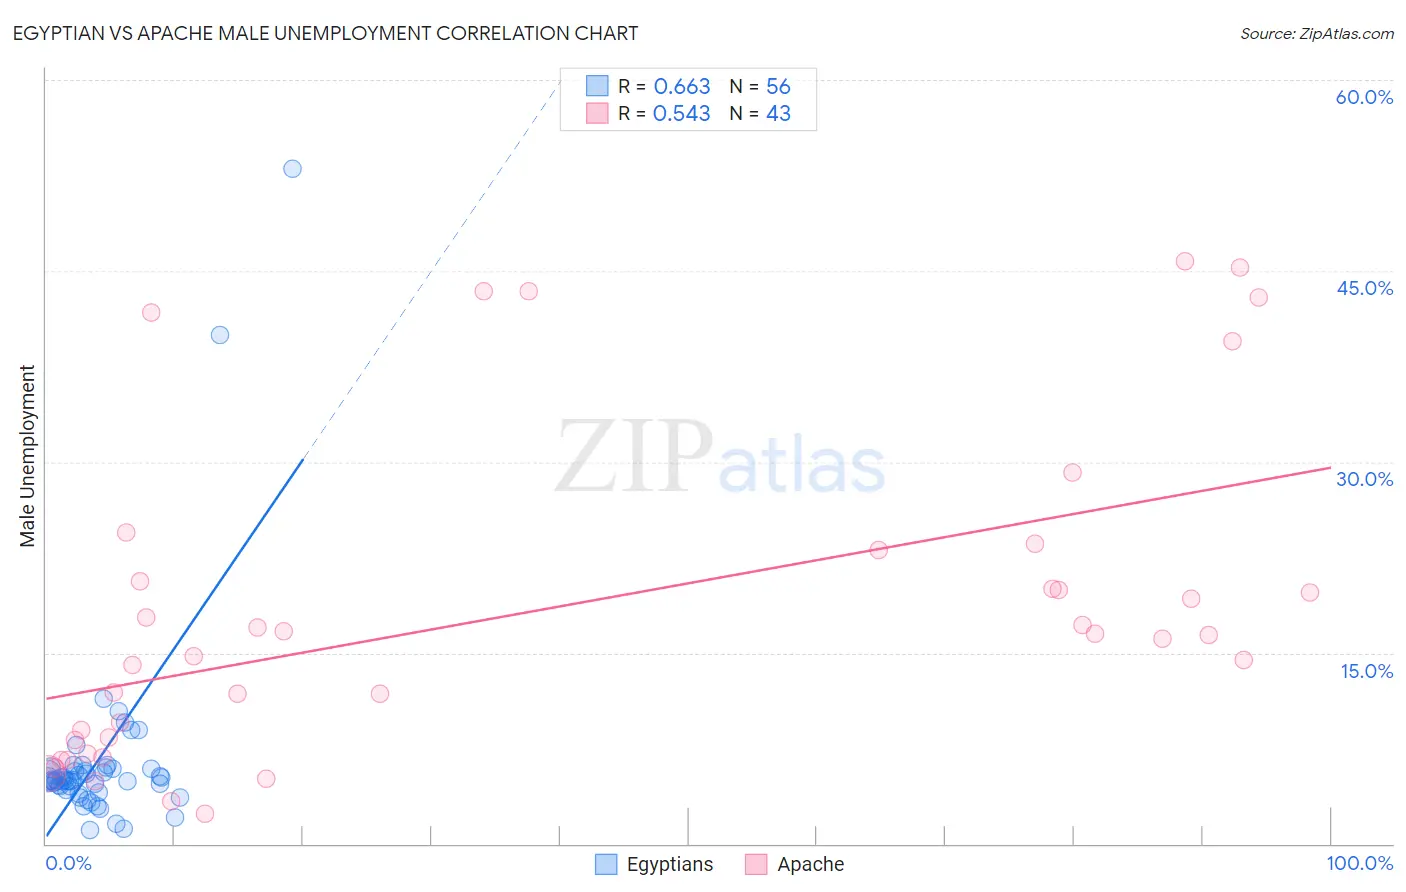
Egyptian vs Apache Male Unemployment Correlation Chart
The statistical analysis conducted on geographies consisting of 276,492,252 people shows a significant positive correlation between the proportion of Egyptians and unemployment rate among males in the United States with a correlation coefficient (R) of 0.663 and weighted average of 5.2%. Similarly, the statistical analysis conducted on geographies consisting of 230,425,231 people shows a substantial positive correlation between the proportion of Apache and unemployment rate among males in the United States with a correlation coefficient (R) of 0.543 and weighted average of 8.6%, a difference of 65.1%.
Male Unemployment Correlation Summary
| Measurement | Egyptian | Apache |
| Minimum | 1.1% | 2.3% |
| Maximum | 53.0% | 45.7% |
| Range | 51.9% | 43.4% |
| Mean | 6.6% | 18.3% |
| Median | 5.0% | 16.4% |
| Interquartile 25% (IQ1) | 4.4% | 8.2% |
| Interquartile 75% (IQ3) | 5.9% | 23.1% |
| Interquartile Range (IQR) | 1.5% | 14.9% |
| Standard Deviation (Sample) | 8.1% | 12.7% |
| Standard Deviation (Population) | 8.0% | 12.6% |
Similar Demographics by Male Unemployment
Demographics Similar to Egyptians by Male Unemployment
In terms of male unemployment, the demographic groups most similar to Egyptians are Slovak (5.2%, a difference of 0.050%), Immigrants from Uruguay (5.2%, a difference of 0.070%), Laotian (5.2%, a difference of 0.080%), Indian (Asian) (5.2%, a difference of 0.090%), and Immigrants from Europe (5.2%, a difference of 0.11%).
| Demographics | Rating | Rank | Male Unemployment |
| Macedonians | 77.7 /100 | #145 | Good 5.2% |
| Immigrants | Kenya | 77.6 /100 | #146 | Good 5.2% |
| Immigrants | Burma/Myanmar | 77.5 /100 | #147 | Good 5.2% |
| Immigrants | Italy | 76.3 /100 | #148 | Good 5.2% |
| Immigrants | Europe | 76.2 /100 | #149 | Good 5.2% |
| Indians (Asian) | 76.0 /100 | #150 | Good 5.2% |
| Slovaks | 75.5 /100 | #151 | Good 5.2% |
| Egyptians | 74.8 /100 | #152 | Good 5.2% |
| Immigrants | Uruguay | 73.9 /100 | #153 | Good 5.2% |
| Laotians | 73.8 /100 | #154 | Good 5.2% |
| Immigrants | Hungary | 73.4 /100 | #155 | Good 5.2% |
| Americans | 72.7 /100 | #156 | Good 5.2% |
| Immigrants | Northern Africa | 72.3 /100 | #157 | Good 5.2% |
| Immigrants | Indonesia | 71.5 /100 | #158 | Good 5.2% |
| Indonesians | 71.2 /100 | #159 | Good 5.2% |
Demographics Similar to Apache by Male Unemployment
In terms of male unemployment, the demographic groups most similar to Apache are Puerto Rican (8.6%, a difference of 0.15%), Yuman (8.6%, a difference of 0.23%), Pueblo (8.5%, a difference of 1.6%), Tsimshian (8.5%, a difference of 1.7%), and Sioux (8.4%, a difference of 2.6%).
| Demographics | Rating | Rank | Male Unemployment |
| Alaska Natives | 0.0 /100 | #331 | Tragic 8.1% |
| Pima | 0.0 /100 | #332 | Tragic 8.3% |
| Sioux | 0.0 /100 | #333 | Tragic 8.4% |
| Tsimshian | 0.0 /100 | #334 | Tragic 8.5% |
| Pueblo | 0.0 /100 | #335 | Tragic 8.5% |
| Yuman | 0.0 /100 | #336 | Tragic 8.6% |
| Puerto Ricans | 0.0 /100 | #337 | Tragic 8.6% |
| Apache | 0.0 /100 | #338 | Tragic 8.6% |
| Cheyenne | 0.0 /100 | #339 | Tragic 9.8% |
| Alaskan Athabascans | 0.0 /100 | #340 | Tragic 9.8% |
| Navajo | 0.0 /100 | #341 | Tragic 9.8% |
| Tohono O'odham | 0.0 /100 | #342 | Tragic 10.2% |
| Crow | 0.0 /100 | #343 | Tragic 10.6% |
| Hopi | 0.0 /100 | #344 | Tragic 10.8% |
| Arapaho | 0.0 /100 | #345 | Tragic 11.0% |