Luxembourger vs Apache Male Unemployment
COMPARE
Luxembourger
Apache
Male Unemployment
Male Unemployment Comparison
Luxembourgers
Apache
4.5%
MALE UNEMPLOYMENT
100.0/ 100
METRIC RATING
8th/ 347
METRIC RANK
8.6%
MALE UNEMPLOYMENT
0.0/ 100
METRIC RATING
338th/ 347
METRIC RANK
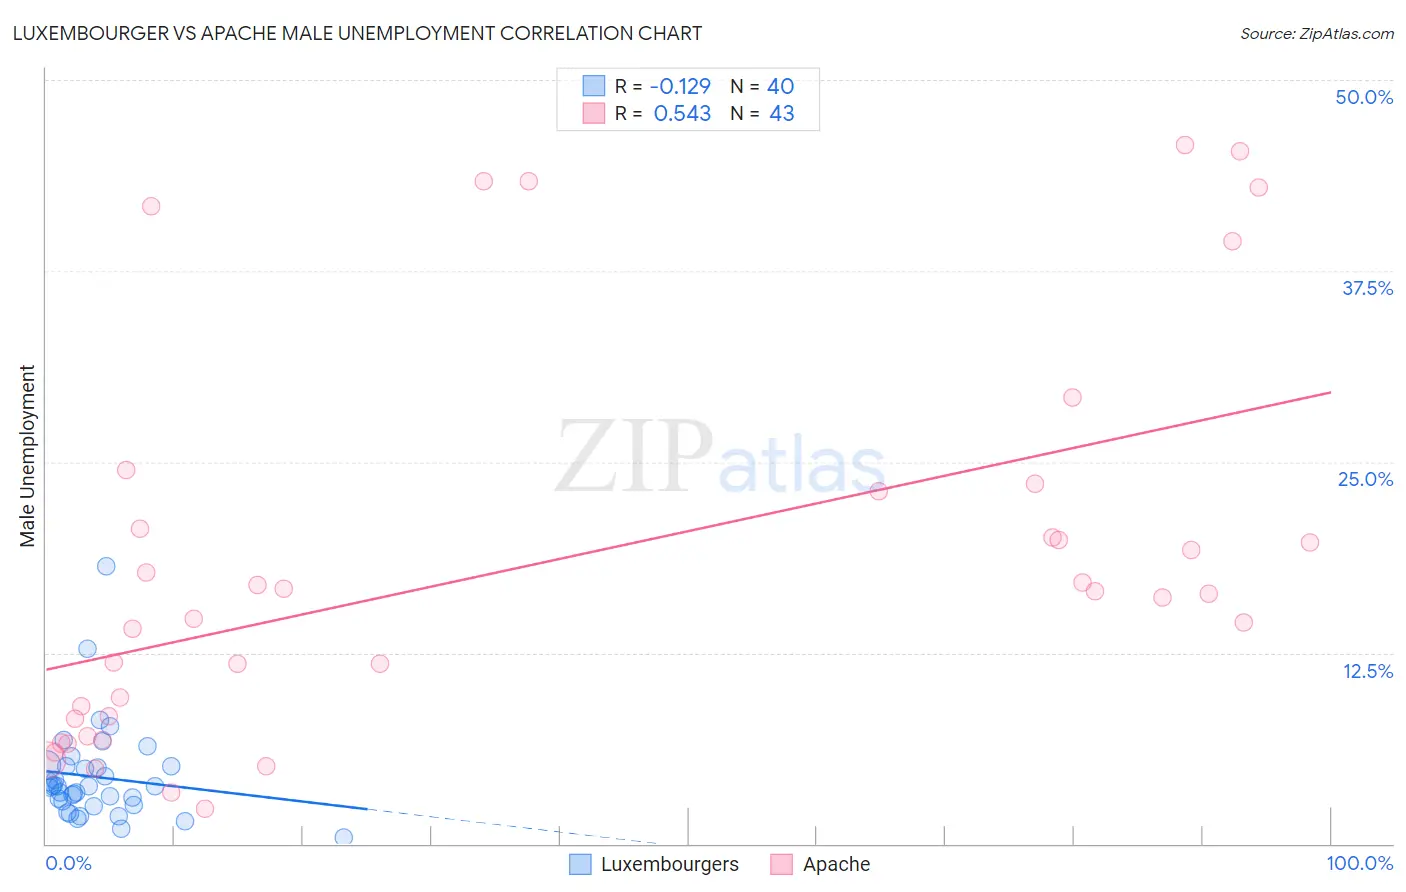
Luxembourger vs Apache Male Unemployment Correlation Chart
The statistical analysis conducted on geographies consisting of 144,259,966 people shows a poor negative correlation between the proportion of Luxembourgers and unemployment rate among males in the United States with a correlation coefficient (R) of -0.129 and weighted average of 4.5%. Similarly, the statistical analysis conducted on geographies consisting of 230,425,231 people shows a substantial positive correlation between the proportion of Apache and unemployment rate among males in the United States with a correlation coefficient (R) of 0.543 and weighted average of 8.6%, a difference of 89.6%.
Male Unemployment Correlation Summary
| Measurement | Luxembourger | Apache |
| Minimum | 0.40% | 2.3% |
| Maximum | 18.2% | 45.7% |
| Range | 17.8% | 43.4% |
| Mean | 4.4% | 18.3% |
| Median | 3.8% | 16.4% |
| Interquartile 25% (IQ1) | 2.6% | 8.2% |
| Interquartile 75% (IQ3) | 5.1% | 23.1% |
| Interquartile Range (IQR) | 2.5% | 14.9% |
| Standard Deviation (Sample) | 3.2% | 12.7% |
| Standard Deviation (Population) | 3.2% | 12.6% |
Similar Demographics by Male Unemployment
Demographics Similar to Luxembourgers by Male Unemployment
In terms of male unemployment, the demographic groups most similar to Luxembourgers are Czech (4.5%, a difference of 0.26%), Venezuelan (4.5%, a difference of 0.46%), Danish (4.5%, a difference of 0.91%), Thai (4.6%, a difference of 1.2%), and Cuban (4.6%, a difference of 1.8%).
| Demographics | Rating | Rank | Male Unemployment |
| Immigrants | India | 100.0 /100 | #1 | Exceptional 4.4% |
| Immigrants | Cuba | 100.0 /100 | #2 | Exceptional 4.4% |
| Norwegians | 100.0 /100 | #3 | Exceptional 4.4% |
| Immigrants | Venezuela | 100.0 /100 | #4 | Exceptional 4.4% |
| Danes | 100.0 /100 | #5 | Exceptional 4.5% |
| Venezuelans | 100.0 /100 | #6 | Exceptional 4.5% |
| Czechs | 100.0 /100 | #7 | Exceptional 4.5% |
| Luxembourgers | 100.0 /100 | #8 | Exceptional 4.5% |
| Thais | 100.0 /100 | #9 | Exceptional 4.6% |
| Cubans | 100.0 /100 | #10 | Exceptional 4.6% |
| Swedes | 100.0 /100 | #11 | Exceptional 4.6% |
| Immigrants | Bolivia | 100.0 /100 | #12 | Exceptional 4.7% |
| Bolivians | 100.0 /100 | #13 | Exceptional 4.7% |
| Germans | 100.0 /100 | #14 | Exceptional 4.7% |
| Scandinavians | 100.0 /100 | #15 | Exceptional 4.7% |
Demographics Similar to Apache by Male Unemployment
In terms of male unemployment, the demographic groups most similar to Apache are Puerto Rican (8.6%, a difference of 0.15%), Yuman (8.6%, a difference of 0.23%), Pueblo (8.5%, a difference of 1.6%), Tsimshian (8.5%, a difference of 1.7%), and Sioux (8.4%, a difference of 2.6%).
| Demographics | Rating | Rank | Male Unemployment |
| Alaska Natives | 0.0 /100 | #331 | Tragic 8.1% |
| Pima | 0.0 /100 | #332 | Tragic 8.3% |
| Sioux | 0.0 /100 | #333 | Tragic 8.4% |
| Tsimshian | 0.0 /100 | #334 | Tragic 8.5% |
| Pueblo | 0.0 /100 | #335 | Tragic 8.5% |
| Yuman | 0.0 /100 | #336 | Tragic 8.6% |
| Puerto Ricans | 0.0 /100 | #337 | Tragic 8.6% |
| Apache | 0.0 /100 | #338 | Tragic 8.6% |
| Cheyenne | 0.0 /100 | #339 | Tragic 9.8% |
| Alaskan Athabascans | 0.0 /100 | #340 | Tragic 9.8% |
| Navajo | 0.0 /100 | #341 | Tragic 9.8% |
| Tohono O'odham | 0.0 /100 | #342 | Tragic 10.2% |
| Crow | 0.0 /100 | #343 | Tragic 10.6% |
| Hopi | 0.0 /100 | #344 | Tragic 10.8% |
| Arapaho | 0.0 /100 | #345 | Tragic 11.0% |