Iranian vs Apache Male Unemployment
COMPARE
Iranian
Apache
Male Unemployment
Male Unemployment Comparison
Iranians
Apache
5.0%
MALE UNEMPLOYMENT
96.4/ 100
METRIC RATING
77th/ 347
METRIC RANK
8.6%
MALE UNEMPLOYMENT
0.0/ 100
METRIC RATING
338th/ 347
METRIC RANK
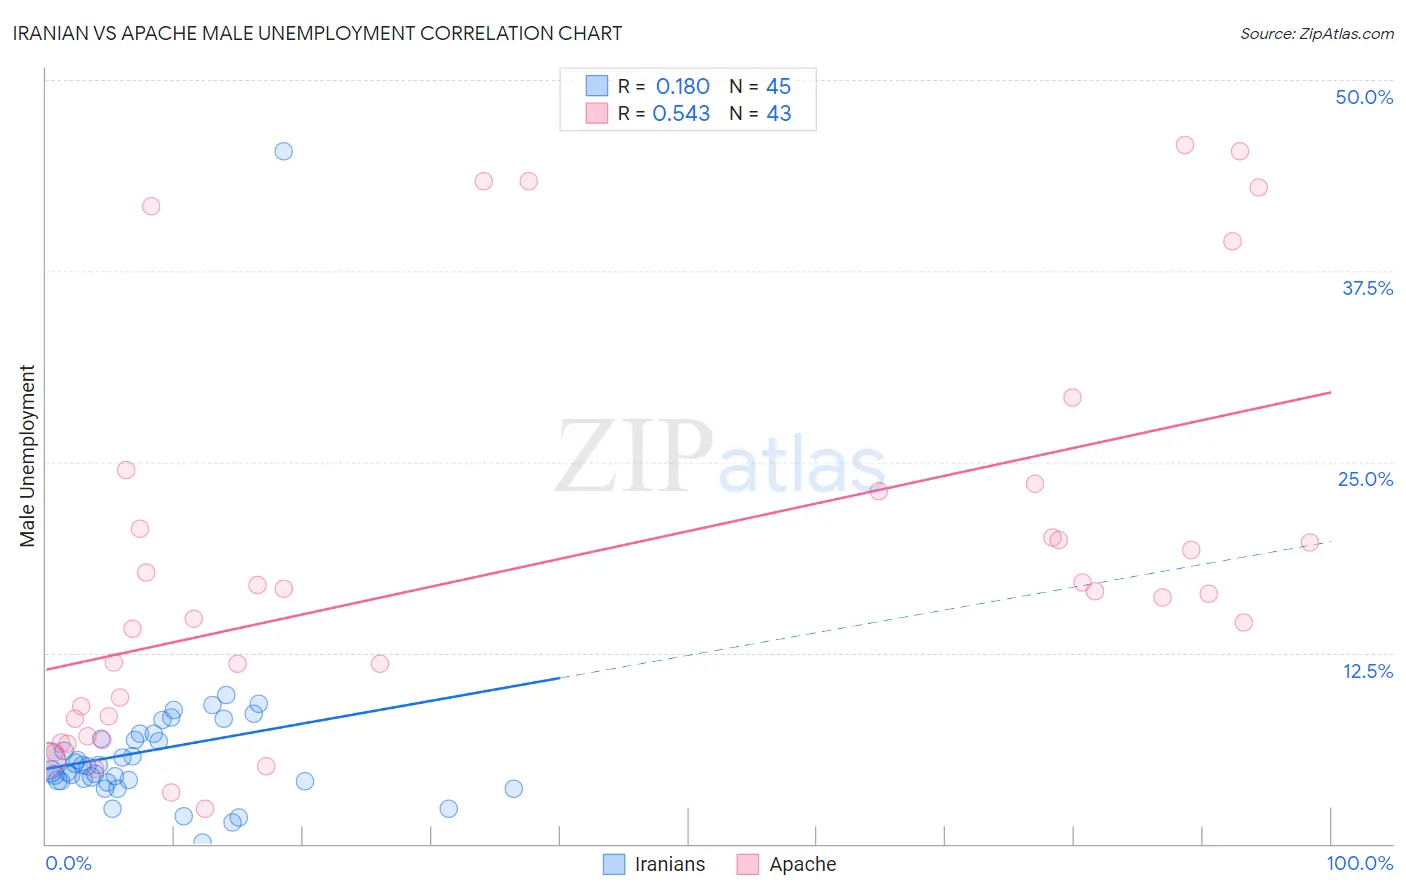
Iranian vs Apache Male Unemployment Correlation Chart
The statistical analysis conducted on geographies consisting of 316,157,253 people shows a poor positive correlation between the proportion of Iranians and unemployment rate among males in the United States with a correlation coefficient (R) of 0.180 and weighted average of 5.0%. Similarly, the statistical analysis conducted on geographies consisting of 230,425,231 people shows a substantial positive correlation between the proportion of Apache and unemployment rate among males in the United States with a correlation coefficient (R) of 0.543 and weighted average of 8.6%, a difference of 70.7%.
Male Unemployment Correlation Summary
| Measurement | Iranian | Apache |
| Minimum | 0.10% | 2.3% |
| Maximum | 45.3% | 45.7% |
| Range | 45.2% | 43.4% |
| Mean | 6.1% | 18.3% |
| Median | 5.1% | 16.4% |
| Interquartile 25% (IQ1) | 4.1% | 8.2% |
| Interquartile 75% (IQ3) | 7.0% | 23.1% |
| Interquartile Range (IQR) | 2.9% | 14.9% |
| Standard Deviation (Sample) | 6.4% | 12.7% |
| Standard Deviation (Population) | 6.3% | 12.6% |
Similar Demographics by Male Unemployment
Demographics Similar to Iranians by Male Unemployment
In terms of male unemployment, the demographic groups most similar to Iranians are Immigrants from Northern Europe (5.0%, a difference of 0.010%), South African (5.0%, a difference of 0.020%), Immigrants from Sudan (5.0%, a difference of 0.050%), Argentinean (5.0%, a difference of 0.080%), and French (5.0%, a difference of 0.080%).
| Demographics | Rating | Rank | Male Unemployment |
| Whites/Caucasians | 97.3 /100 | #70 | Exceptional 5.0% |
| New Zealanders | 97.3 /100 | #71 | Exceptional 5.0% |
| Immigrants | South Africa | 97.1 /100 | #72 | Exceptional 5.0% |
| Greeks | 97.0 /100 | #73 | Exceptional 5.0% |
| Immigrants | North America | 96.9 /100 | #74 | Exceptional 5.0% |
| Assyrians/Chaldeans/Syriacs | 96.9 /100 | #75 | Exceptional 5.0% |
| Immigrants | Sudan | 96.5 /100 | #76 | Exceptional 5.0% |
| Iranians | 96.4 /100 | #77 | Exceptional 5.0% |
| Immigrants | Northern Europe | 96.4 /100 | #78 | Exceptional 5.0% |
| South Africans | 96.4 /100 | #79 | Exceptional 5.0% |
| Argentineans | 96.2 /100 | #80 | Exceptional 5.0% |
| French | 96.2 /100 | #81 | Exceptional 5.0% |
| Chileans | 96.2 /100 | #82 | Exceptional 5.0% |
| Immigrants | Eritrea | 96.0 /100 | #83 | Exceptional 5.0% |
| Serbians | 95.7 /100 | #84 | Exceptional 5.1% |
Demographics Similar to Apache by Male Unemployment
In terms of male unemployment, the demographic groups most similar to Apache are Puerto Rican (8.6%, a difference of 0.15%), Yuman (8.6%, a difference of 0.23%), Pueblo (8.5%, a difference of 1.6%), Tsimshian (8.5%, a difference of 1.7%), and Sioux (8.4%, a difference of 2.6%).
| Demographics | Rating | Rank | Male Unemployment |
| Alaska Natives | 0.0 /100 | #331 | Tragic 8.1% |
| Pima | 0.0 /100 | #332 | Tragic 8.3% |
| Sioux | 0.0 /100 | #333 | Tragic 8.4% |
| Tsimshian | 0.0 /100 | #334 | Tragic 8.5% |
| Pueblo | 0.0 /100 | #335 | Tragic 8.5% |
| Yuman | 0.0 /100 | #336 | Tragic 8.6% |
| Puerto Ricans | 0.0 /100 | #337 | Tragic 8.6% |
| Apache | 0.0 /100 | #338 | Tragic 8.6% |
| Cheyenne | 0.0 /100 | #339 | Tragic 9.8% |
| Alaskan Athabascans | 0.0 /100 | #340 | Tragic 9.8% |
| Navajo | 0.0 /100 | #341 | Tragic 9.8% |
| Tohono O'odham | 0.0 /100 | #342 | Tragic 10.2% |
| Crow | 0.0 /100 | #343 | Tragic 10.6% |
| Hopi | 0.0 /100 | #344 | Tragic 10.8% |
| Arapaho | 0.0 /100 | #345 | Tragic 11.0% |