Immigrants from Netherlands vs British West Indian Unemployment
COMPARE
Immigrants from Netherlands
British West Indian
Unemployment
Unemployment Comparison
Immigrants from Netherlands
British West Indians
4.9%
UNEMPLOYMENT
99.0/ 100
METRIC RATING
60th/ 347
METRIC RANK
6.8%
UNEMPLOYMENT
0.0/ 100
METRIC RATING
319th/ 347
METRIC RANK
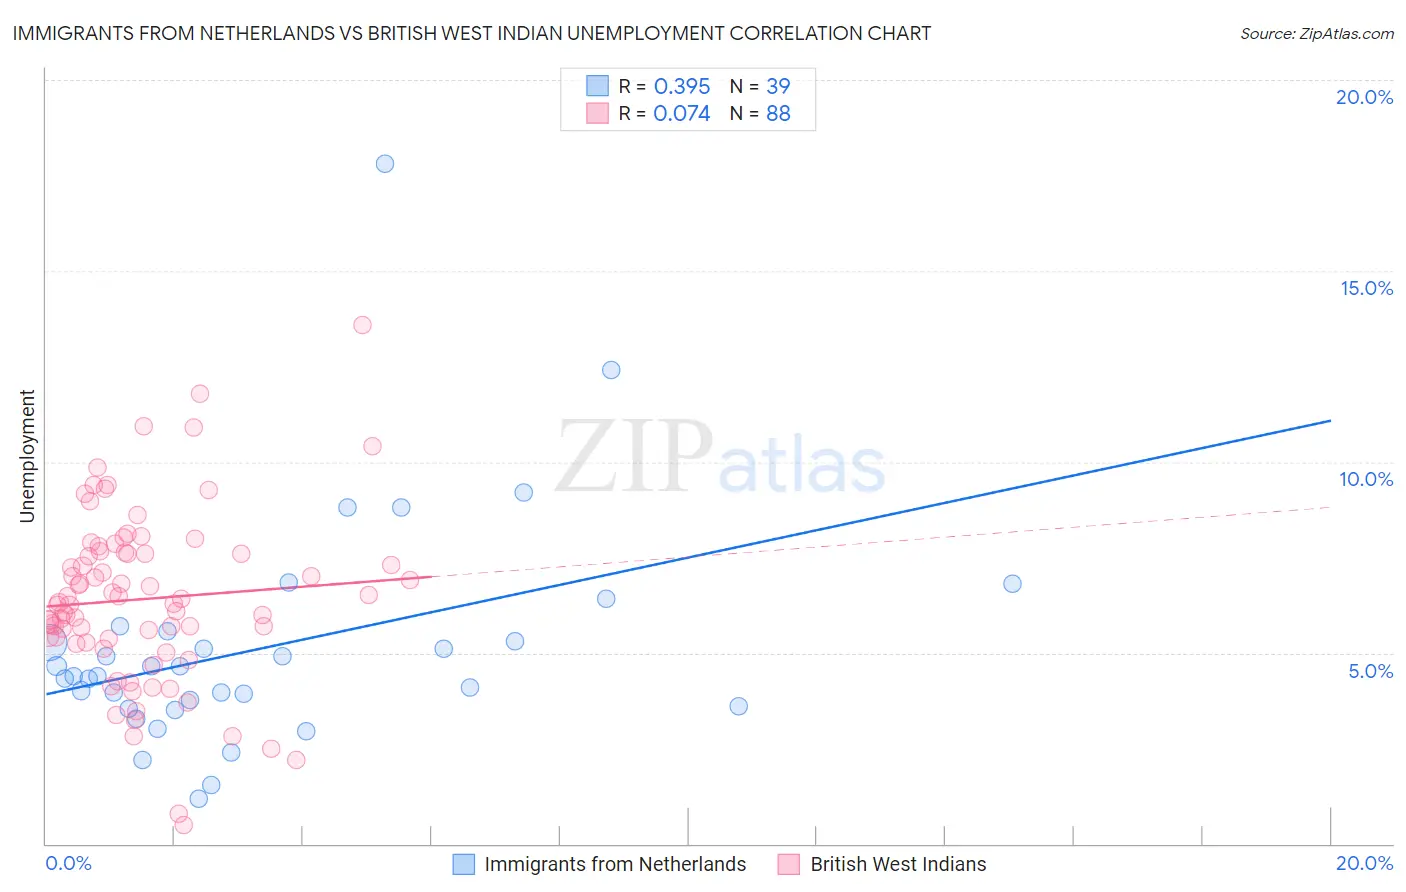
Immigrants from Netherlands vs British West Indian Unemployment Correlation Chart
The statistical analysis conducted on geographies consisting of 237,753,486 people shows a mild positive correlation between the proportion of Immigrants from Netherlands and unemployment in the United States with a correlation coefficient (R) of 0.395 and weighted average of 4.9%. Similarly, the statistical analysis conducted on geographies consisting of 152,665,255 people shows a slight positive correlation between the proportion of British West Indians and unemployment in the United States with a correlation coefficient (R) of 0.074 and weighted average of 6.8%, a difference of 39.8%.
Unemployment Correlation Summary
| Measurement | Immigrants from Netherlands | British West Indian |
| Minimum | 1.2% | 0.50% |
| Maximum | 17.8% | 13.6% |
| Range | 16.6% | 13.1% |
| Mean | 5.2% | 6.4% |
| Median | 4.4% | 6.3% |
| Interquartile 25% (IQ1) | 3.6% | 5.3% |
| Interquartile 75% (IQ3) | 5.6% | 7.6% |
| Interquartile Range (IQR) | 2.0% | 2.3% |
| Standard Deviation (Sample) | 3.0% | 2.3% |
| Standard Deviation (Population) | 3.0% | 2.3% |
Similar Demographics by Unemployment
Demographics Similar to Immigrants from Netherlands by Unemployment
In terms of unemployment, the demographic groups most similar to Immigrants from Netherlands are Cambodian (4.9%, a difference of 0.0%), Icelander (4.9%, a difference of 0.010%), Immigrants from Bulgaria (4.9%, a difference of 0.030%), Bhutanese (4.9%, a difference of 0.050%), and Greek (4.9%, a difference of 0.070%).
| Demographics | Rating | Rank | Unemployment |
| Immigrants | Zimbabwe | 99.2 /100 | #53 | Exceptional 4.9% |
| Eastern Europeans | 99.2 /100 | #54 | Exceptional 4.9% |
| Australians | 99.2 /100 | #55 | Exceptional 4.9% |
| Celtics | 99.1 /100 | #56 | Exceptional 4.9% |
| Immigrants | Singapore | 99.1 /100 | #57 | Exceptional 4.9% |
| Greeks | 99.0 /100 | #58 | Exceptional 4.9% |
| Bhutanese | 99.0 /100 | #59 | Exceptional 4.9% |
| Immigrants | Netherlands | 99.0 /100 | #60 | Exceptional 4.9% |
| Cambodians | 99.0 /100 | #61 | Exceptional 4.9% |
| Icelanders | 98.9 /100 | #62 | Exceptional 4.9% |
| Immigrants | Bulgaria | 98.9 /100 | #63 | Exceptional 4.9% |
| Italians | 98.9 /100 | #64 | Exceptional 4.9% |
| Immigrants | Canada | 98.8 /100 | #65 | Exceptional 4.9% |
| Slovaks | 98.7 /100 | #66 | Exceptional 4.9% |
| New Zealanders | 98.6 /100 | #67 | Exceptional 4.9% |
Demographics Similar to British West Indians by Unemployment
In terms of unemployment, the demographic groups most similar to British West Indians are Immigrants from Cabo Verde (6.8%, a difference of 0.21%), Immigrants from St. Vincent and the Grenadines (6.9%, a difference of 0.79%), Shoshone (6.8%, a difference of 0.81%), Immigrants from Guyana (6.9%, a difference of 0.81%), and Guyanese (6.9%, a difference of 0.85%).
| Demographics | Rating | Rank | Unemployment |
| Colville | 0.0 /100 | #312 | Tragic 6.6% |
| Immigrants | Barbados | 0.0 /100 | #313 | Tragic 6.6% |
| Blacks/African Americans | 0.0 /100 | #314 | Tragic 6.6% |
| Houma | 0.0 /100 | #315 | Tragic 6.7% |
| Immigrants | Dominica | 0.0 /100 | #316 | Tragic 6.7% |
| Shoshone | 0.0 /100 | #317 | Tragic 6.8% |
| Immigrants | Cabo Verde | 0.0 /100 | #318 | Tragic 6.8% |
| British West Indians | 0.0 /100 | #319 | Tragic 6.8% |
| Immigrants | St. Vincent and the Grenadines | 0.0 /100 | #320 | Tragic 6.9% |
| Immigrants | Guyana | 0.0 /100 | #321 | Tragic 6.9% |
| Guyanese | 0.0 /100 | #322 | Tragic 6.9% |
| Immigrants | Grenada | 0.0 /100 | #323 | Tragic 6.9% |
| Immigrants | Armenia | 0.0 /100 | #324 | Tragic 7.0% |
| Natives/Alaskans | 0.0 /100 | #325 | Tragic 7.0% |
| Paiute | 0.0 /100 | #326 | Tragic 7.1% |