Immigrants from Netherlands vs American Unemployment
COMPARE
Immigrants from Netherlands
American
Unemployment
Unemployment Comparison
Immigrants from Netherlands
Americans
4.9%
UNEMPLOYMENT
99.0/ 100
METRIC RATING
60th/ 347
METRIC RANK
5.0%
UNEMPLOYMENT
94.3/ 100
METRIC RATING
101st/ 347
METRIC RANK
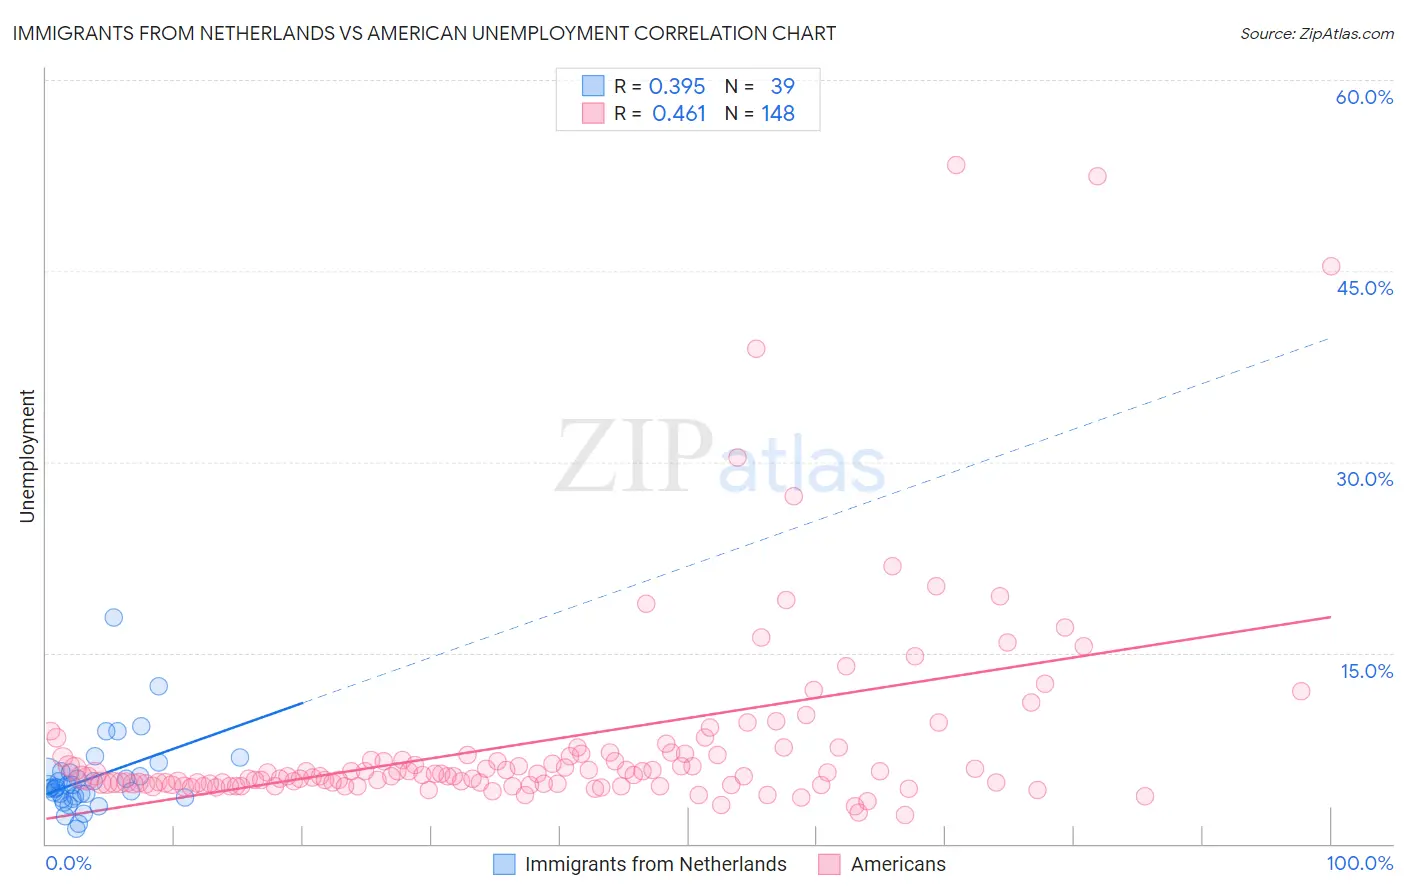
Immigrants from Netherlands vs American Unemployment Correlation Chart
The statistical analysis conducted on geographies consisting of 237,753,486 people shows a mild positive correlation between the proportion of Immigrants from Netherlands and unemployment in the United States with a correlation coefficient (R) of 0.395 and weighted average of 4.9%. Similarly, the statistical analysis conducted on geographies consisting of 576,683,680 people shows a moderate positive correlation between the proportion of Americans and unemployment in the United States with a correlation coefficient (R) of 0.461 and weighted average of 5.0%, a difference of 2.9%.
Unemployment Correlation Summary
| Measurement | Immigrants from Netherlands | American |
| Minimum | 1.2% | 2.2% |
| Maximum | 17.8% | 53.3% |
| Range | 16.6% | 51.1% |
| Mean | 5.2% | 8.0% |
| Median | 4.4% | 5.4% |
| Interquartile 25% (IQ1) | 3.6% | 4.7% |
| Interquartile 75% (IQ3) | 5.6% | 7.0% |
| Interquartile Range (IQR) | 2.0% | 2.3% |
| Standard Deviation (Sample) | 3.0% | 8.0% |
| Standard Deviation (Population) | 3.0% | 8.0% |
Similar Demographics by Unemployment
Demographics Similar to Immigrants from Netherlands by Unemployment
In terms of unemployment, the demographic groups most similar to Immigrants from Netherlands are Cambodian (4.9%, a difference of 0.0%), Icelander (4.9%, a difference of 0.010%), Immigrants from Bulgaria (4.9%, a difference of 0.030%), Bhutanese (4.9%, a difference of 0.050%), and Greek (4.9%, a difference of 0.070%).
| Demographics | Rating | Rank | Unemployment |
| Immigrants | Zimbabwe | 99.2 /100 | #53 | Exceptional 4.9% |
| Eastern Europeans | 99.2 /100 | #54 | Exceptional 4.9% |
| Australians | 99.2 /100 | #55 | Exceptional 4.9% |
| Celtics | 99.1 /100 | #56 | Exceptional 4.9% |
| Immigrants | Singapore | 99.1 /100 | #57 | Exceptional 4.9% |
| Greeks | 99.0 /100 | #58 | Exceptional 4.9% |
| Bhutanese | 99.0 /100 | #59 | Exceptional 4.9% |
| Immigrants | Netherlands | 99.0 /100 | #60 | Exceptional 4.9% |
| Cambodians | 99.0 /100 | #61 | Exceptional 4.9% |
| Icelanders | 98.9 /100 | #62 | Exceptional 4.9% |
| Immigrants | Bulgaria | 98.9 /100 | #63 | Exceptional 4.9% |
| Italians | 98.9 /100 | #64 | Exceptional 4.9% |
| Immigrants | Canada | 98.8 /100 | #65 | Exceptional 4.9% |
| Slovaks | 98.7 /100 | #66 | Exceptional 4.9% |
| New Zealanders | 98.6 /100 | #67 | Exceptional 4.9% |
Demographics Similar to Americans by Unemployment
In terms of unemployment, the demographic groups most similar to Americans are Immigrants from Argentina (5.0%, a difference of 0.050%), Chickasaw (5.0%, a difference of 0.080%), Osage (5.0%, a difference of 0.080%), Maltese (5.0%, a difference of 0.090%), and Estonian (5.0%, a difference of 0.10%).
| Demographics | Rating | Rank | Unemployment |
| Immigrants | Austria | 95.9 /100 | #94 | Exceptional 5.0% |
| Immigrants | Serbia | 95.6 /100 | #95 | Exceptional 5.0% |
| Immigrants | England | 95.2 /100 | #96 | Exceptional 5.0% |
| Immigrants | Czechoslovakia | 95.1 /100 | #97 | Exceptional 5.0% |
| Romanians | 95.0 /100 | #98 | Exceptional 5.0% |
| Mongolians | 94.8 /100 | #99 | Exceptional 5.0% |
| Estonians | 94.6 /100 | #100 | Exceptional 5.0% |
| Americans | 94.3 /100 | #101 | Exceptional 5.0% |
| Immigrants | Argentina | 94.1 /100 | #102 | Exceptional 5.0% |
| Chickasaw | 94.0 /100 | #103 | Exceptional 5.0% |
| Osage | 94.0 /100 | #104 | Exceptional 5.0% |
| Maltese | 94.0 /100 | #105 | Exceptional 5.0% |
| Immigrants | Romania | 93.7 /100 | #106 | Exceptional 5.0% |
| Immigrants | Turkey | 93.7 /100 | #107 | Exceptional 5.0% |
| Immigrants | Kuwait | 93.7 /100 | #108 | Exceptional 5.0% |