German vs British West Indian Unemployment
COMPARE
German
British West Indian
Unemployment
Unemployment Comparison
Germans
British West Indians
4.5%
UNEMPLOYMENT
100.0/ 100
METRIC RATING
6th/ 347
METRIC RANK
6.8%
UNEMPLOYMENT
0.0/ 100
METRIC RATING
319th/ 347
METRIC RANK
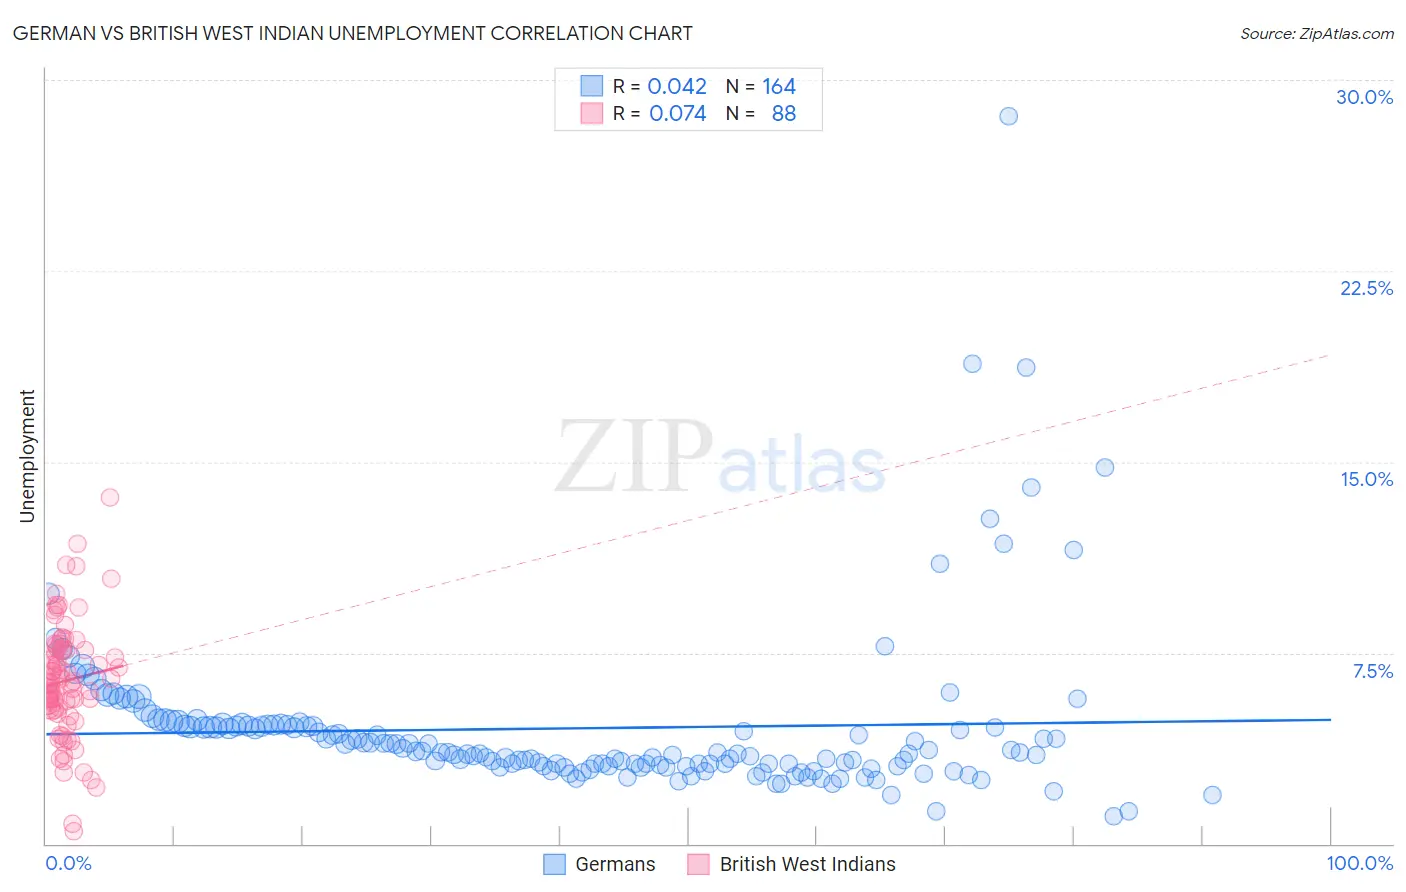
German vs British West Indian Unemployment Correlation Chart
The statistical analysis conducted on geographies consisting of 575,448,590 people shows no correlation between the proportion of Germans and unemployment in the United States with a correlation coefficient (R) of 0.042 and weighted average of 4.5%. Similarly, the statistical analysis conducted on geographies consisting of 152,665,255 people shows a slight positive correlation between the proportion of British West Indians and unemployment in the United States with a correlation coefficient (R) of 0.074 and weighted average of 6.8%, a difference of 52.4%.
Unemployment Correlation Summary
| Measurement | German | British West Indian |
| Minimum | 1.1% | 0.50% |
| Maximum | 28.6% | 13.6% |
| Range | 27.5% | 13.1% |
| Mean | 4.5% | 6.4% |
| Median | 3.6% | 6.3% |
| Interquartile 25% (IQ1) | 3.1% | 5.3% |
| Interquartile 75% (IQ3) | 4.6% | 7.6% |
| Interquartile Range (IQR) | 1.6% | 2.3% |
| Standard Deviation (Sample) | 3.3% | 2.3% |
| Standard Deviation (Population) | 3.2% | 2.3% |
Similar Demographics by Unemployment
Demographics Similar to Germans by Unemployment
In terms of unemployment, the demographic groups most similar to Germans are Immigrants from India (4.5%, a difference of 0.55%), Swedish (4.4%, a difference of 0.79%), Swiss (4.5%, a difference of 1.0%), Scandinavian (4.5%, a difference of 1.4%), and Dutch (4.6%, a difference of 1.9%).
| Demographics | Rating | Rank | Unemployment |
| Norwegians | 100.0 /100 | #1 | Exceptional 4.2% |
| Luxembourgers | 100.0 /100 | #2 | Exceptional 4.3% |
| Czechs | 100.0 /100 | #3 | Exceptional 4.3% |
| Danes | 100.0 /100 | #4 | Exceptional 4.3% |
| Swedes | 100.0 /100 | #5 | Exceptional 4.4% |
| Germans | 100.0 /100 | #6 | Exceptional 4.5% |
| Immigrants | India | 100.0 /100 | #7 | Exceptional 4.5% |
| Swiss | 100.0 /100 | #8 | Exceptional 4.5% |
| Scandinavians | 100.0 /100 | #9 | Exceptional 4.5% |
| Dutch | 100.0 /100 | #10 | Exceptional 4.6% |
| English | 100.0 /100 | #11 | Exceptional 4.6% |
| Pennsylvania Germans | 100.0 /100 | #12 | Exceptional 4.6% |
| Belgians | 100.0 /100 | #13 | Exceptional 4.6% |
| Immigrants | Cuba | 100.0 /100 | #14 | Exceptional 4.6% |
| Europeans | 99.9 /100 | #15 | Exceptional 4.6% |
Demographics Similar to British West Indians by Unemployment
In terms of unemployment, the demographic groups most similar to British West Indians are Immigrants from Cabo Verde (6.8%, a difference of 0.21%), Immigrants from St. Vincent and the Grenadines (6.9%, a difference of 0.79%), Shoshone (6.8%, a difference of 0.81%), Immigrants from Guyana (6.9%, a difference of 0.81%), and Guyanese (6.9%, a difference of 0.85%).
| Demographics | Rating | Rank | Unemployment |
| Colville | 0.0 /100 | #312 | Tragic 6.6% |
| Immigrants | Barbados | 0.0 /100 | #313 | Tragic 6.6% |
| Blacks/African Americans | 0.0 /100 | #314 | Tragic 6.6% |
| Houma | 0.0 /100 | #315 | Tragic 6.7% |
| Immigrants | Dominica | 0.0 /100 | #316 | Tragic 6.7% |
| Shoshone | 0.0 /100 | #317 | Tragic 6.8% |
| Immigrants | Cabo Verde | 0.0 /100 | #318 | Tragic 6.8% |
| British West Indians | 0.0 /100 | #319 | Tragic 6.8% |
| Immigrants | St. Vincent and the Grenadines | 0.0 /100 | #320 | Tragic 6.9% |
| Immigrants | Guyana | 0.0 /100 | #321 | Tragic 6.9% |
| Guyanese | 0.0 /100 | #322 | Tragic 6.9% |
| Immigrants | Grenada | 0.0 /100 | #323 | Tragic 6.9% |
| Immigrants | Armenia | 0.0 /100 | #324 | Tragic 7.0% |
| Natives/Alaskans | 0.0 /100 | #325 | Tragic 7.0% |
| Paiute | 0.0 /100 | #326 | Tragic 7.1% |