Immigrants from West Indies vs British West Indian Unemployment
COMPARE
Immigrants from West Indies
British West Indian
Unemployment
Unemployment Comparison
Immigrants from West Indies
British West Indians
6.3%
UNEMPLOYMENT
0.0/ 100
METRIC RATING
299th/ 347
METRIC RANK
6.8%
UNEMPLOYMENT
0.0/ 100
METRIC RATING
319th/ 347
METRIC RANK
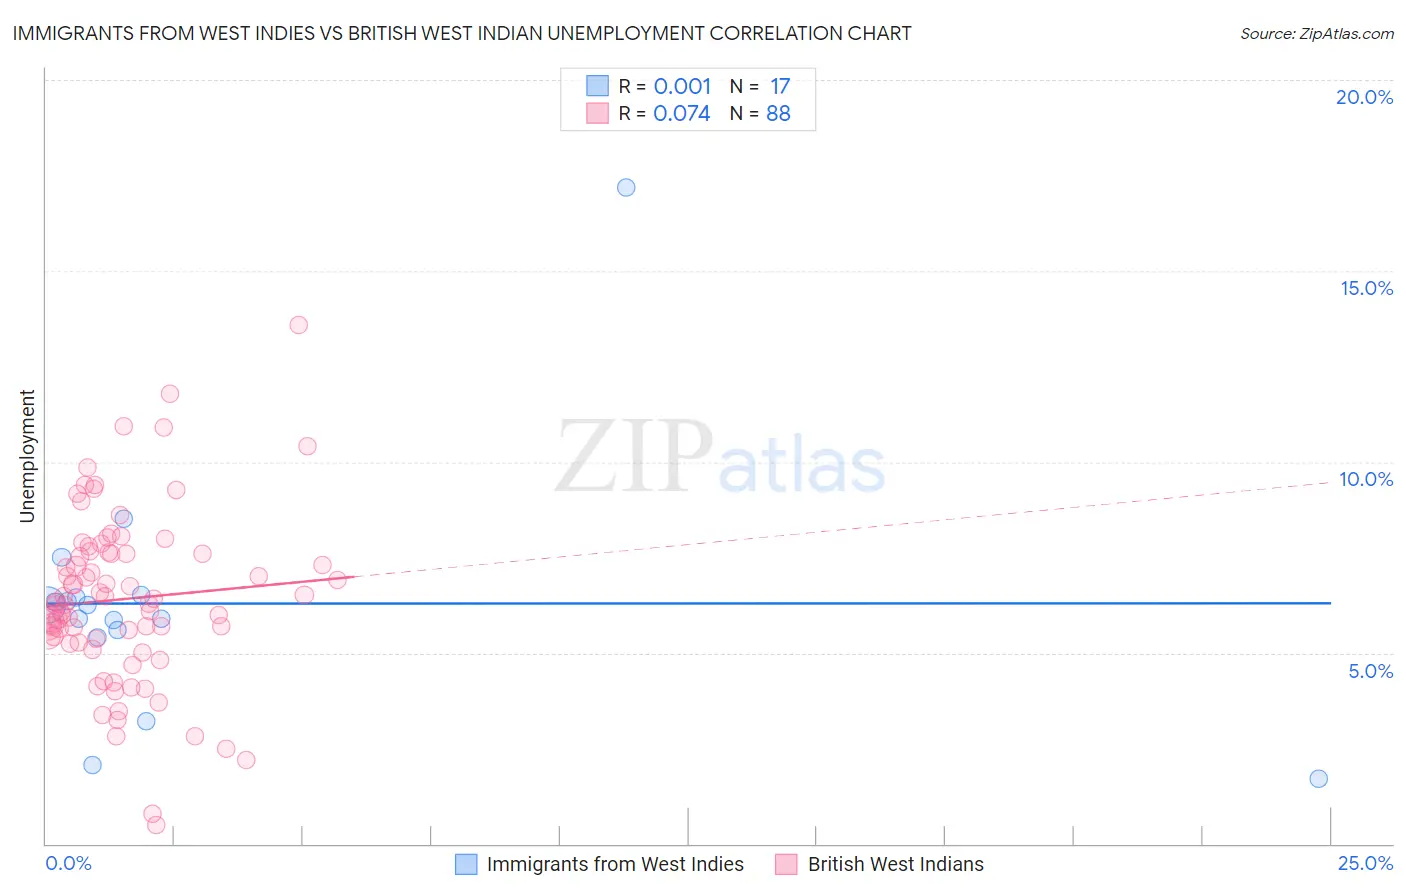
Immigrants from West Indies vs British West Indian Unemployment Correlation Chart
The statistical analysis conducted on geographies consisting of 72,442,388 people shows no correlation between the proportion of Immigrants from West Indies and unemployment in the United States with a correlation coefficient (R) of 0.001 and weighted average of 6.3%. Similarly, the statistical analysis conducted on geographies consisting of 152,665,255 people shows a slight positive correlation between the proportion of British West Indians and unemployment in the United States with a correlation coefficient (R) of 0.074 and weighted average of 6.8%, a difference of 8.3%.
Unemployment Correlation Summary
| Measurement | Immigrants from West Indies | British West Indian |
| Minimum | 1.7% | 0.50% |
| Maximum | 17.2% | 13.6% |
| Range | 15.5% | 13.1% |
| Mean | 6.3% | 6.4% |
| Median | 6.2% | 6.3% |
| Interquartile 25% (IQ1) | 5.5% | 5.3% |
| Interquartile 75% (IQ3) | 6.5% | 7.6% |
| Interquartile Range (IQR) | 0.97% | 2.3% |
| Standard Deviation (Sample) | 3.3% | 2.3% |
| Standard Deviation (Population) | 3.2% | 2.3% |
Demographics Similar to Immigrants from West Indies and British West Indians by Unemployment
In terms of unemployment, the demographic groups most similar to Immigrants from West Indies are Immigrants from Trinidad and Tobago (6.3%, a difference of 0.12%), Trinidadian and Tobagonian (6.3%, a difference of 0.60%), West Indian (6.4%, a difference of 0.86%), Belizean (6.4%, a difference of 1.1%), and Immigrants from Jamaica (6.4%, a difference of 1.8%). Similarly, the demographic groups most similar to British West Indians are Immigrants from Cabo Verde (6.8%, a difference of 0.21%), Shoshone (6.8%, a difference of 0.81%), Immigrants from Dominica (6.7%, a difference of 1.4%), Houma (6.7%, a difference of 2.2%), and Black/African American (6.6%, a difference of 3.0%).
| Demographics | Rating | Rank | Unemployment |
| Immigrants | West Indies | 0.0 /100 | #299 | Tragic 6.3% |
| Immigrants | Trinidad and Tobago | 0.0 /100 | #300 | Tragic 6.3% |
| Trinidadians and Tobagonians | 0.0 /100 | #301 | Tragic 6.3% |
| West Indians | 0.0 /100 | #302 | Tragic 6.4% |
| Belizeans | 0.0 /100 | #303 | Tragic 6.4% |
| Immigrants | Jamaica | 0.0 /100 | #304 | Tragic 6.4% |
| Menominee | 0.0 /100 | #305 | Tragic 6.4% |
| Lumbee | 0.0 /100 | #306 | Tragic 6.4% |
| Immigrants | Bangladesh | 0.0 /100 | #307 | Tragic 6.5% |
| Barbadians | 0.0 /100 | #308 | Tragic 6.5% |
| Vietnamese | 0.0 /100 | #309 | Tragic 6.5% |
| Immigrants | Belize | 0.0 /100 | #310 | Tragic 6.5% |
| Cape Verdeans | 0.0 /100 | #311 | Tragic 6.5% |
| Colville | 0.0 /100 | #312 | Tragic 6.6% |
| Immigrants | Barbados | 0.0 /100 | #313 | Tragic 6.6% |
| Blacks/African Americans | 0.0 /100 | #314 | Tragic 6.6% |
| Houma | 0.0 /100 | #315 | Tragic 6.7% |
| Immigrants | Dominica | 0.0 /100 | #316 | Tragic 6.7% |
| Shoshone | 0.0 /100 | #317 | Tragic 6.8% |
| Immigrants | Cabo Verde | 0.0 /100 | #318 | Tragic 6.8% |
| British West Indians | 0.0 /100 | #319 | Tragic 6.8% |