Immigrants from Netherlands vs Burmese Unemployment
COMPARE
Immigrants from Netherlands
Burmese
Unemployment
Unemployment Comparison
Immigrants from Netherlands
Burmese
4.9%
UNEMPLOYMENT
99.0/ 100
METRIC RATING
60th/ 347
METRIC RANK
4.9%
UNEMPLOYMENT
98.3/ 100
METRIC RATING
72nd/ 347
METRIC RANK
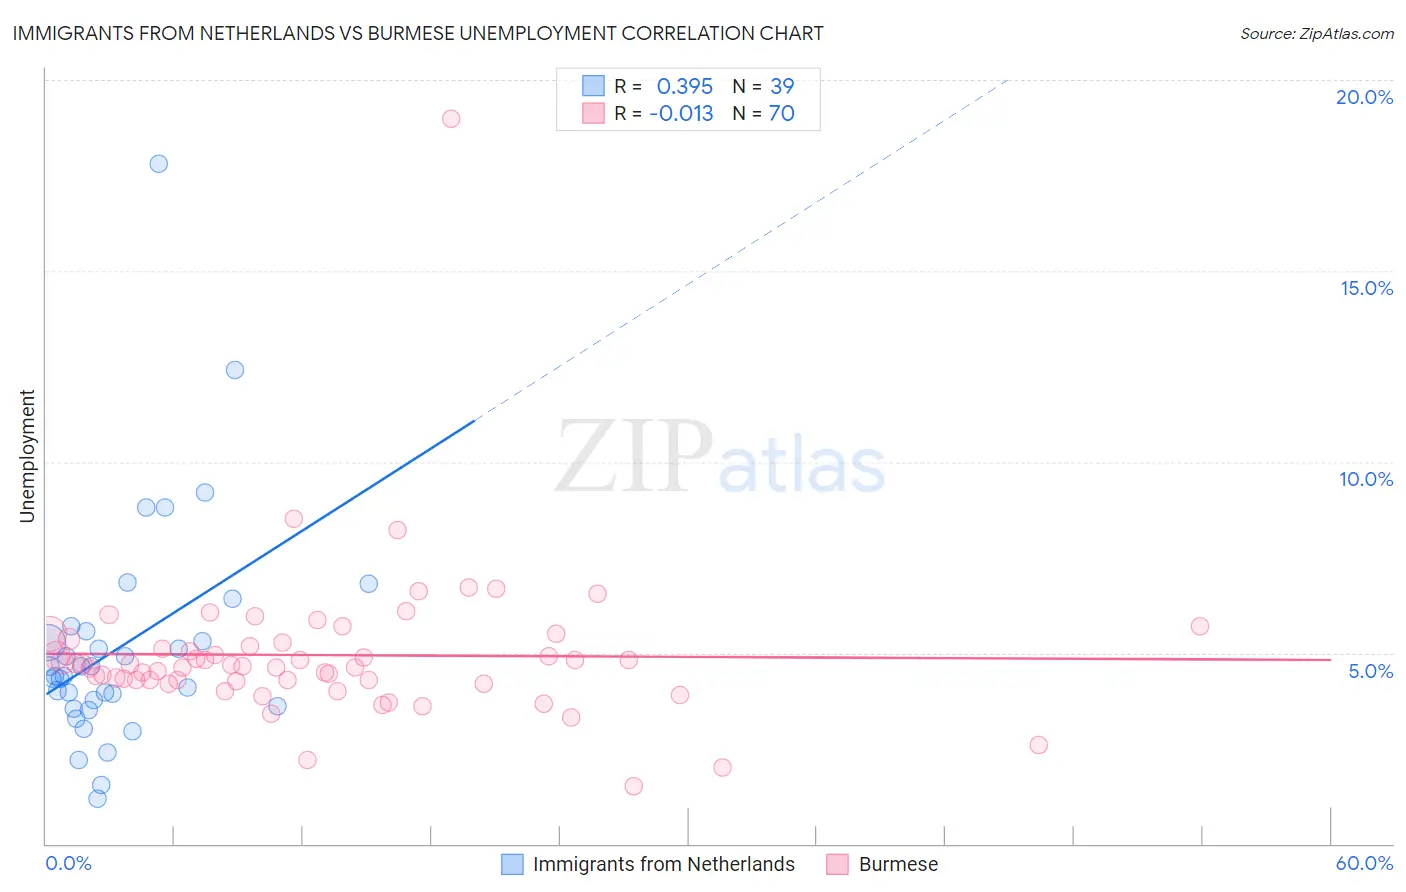
Immigrants from Netherlands vs Burmese Unemployment Correlation Chart
The statistical analysis conducted on geographies consisting of 237,753,486 people shows a mild positive correlation between the proportion of Immigrants from Netherlands and unemployment in the United States with a correlation coefficient (R) of 0.395 and weighted average of 4.9%. Similarly, the statistical analysis conducted on geographies consisting of 464,710,374 people shows no correlation between the proportion of Burmese and unemployment in the United States with a correlation coefficient (R) of -0.013 and weighted average of 4.9%, a difference of 0.79%.
Unemployment Correlation Summary
| Measurement | Immigrants from Netherlands | Burmese |
| Minimum | 1.2% | 1.5% |
| Maximum | 17.8% | 19.0% |
| Range | 16.6% | 17.5% |
| Mean | 5.2% | 4.9% |
| Median | 4.4% | 4.7% |
| Interquartile 25% (IQ1) | 3.6% | 4.3% |
| Interquartile 75% (IQ3) | 5.6% | 5.3% |
| Interquartile Range (IQR) | 2.0% | 0.98% |
| Standard Deviation (Sample) | 3.0% | 2.1% |
| Standard Deviation (Population) | 3.0% | 2.1% |
Demographics Similar to Immigrants from Netherlands and Burmese by Unemployment
In terms of unemployment, the demographic groups most similar to Immigrants from Netherlands are Cambodian (4.9%, a difference of 0.0%), Icelander (4.9%, a difference of 0.010%), Immigrants from Bulgaria (4.9%, a difference of 0.030%), Bhutanese (4.9%, a difference of 0.050%), and Greek (4.9%, a difference of 0.070%). Similarly, the demographic groups most similar to Burmese are Immigrants from Japan (4.9%, a difference of 0.020%), Paraguayan (4.9%, a difference of 0.040%), Serbian (4.9%, a difference of 0.080%), Immigrants from Northern Europe (4.9%, a difference of 0.14%), and Immigrants from North America (4.9%, a difference of 0.23%).
| Demographics | Rating | Rank | Unemployment |
| Celtics | 99.1 /100 | #56 | Exceptional 4.9% |
| Immigrants | Singapore | 99.1 /100 | #57 | Exceptional 4.9% |
| Greeks | 99.0 /100 | #58 | Exceptional 4.9% |
| Bhutanese | 99.0 /100 | #59 | Exceptional 4.9% |
| Immigrants | Netherlands | 99.0 /100 | #60 | Exceptional 4.9% |
| Cambodians | 99.0 /100 | #61 | Exceptional 4.9% |
| Icelanders | 98.9 /100 | #62 | Exceptional 4.9% |
| Immigrants | Bulgaria | 98.9 /100 | #63 | Exceptional 4.9% |
| Italians | 98.9 /100 | #64 | Exceptional 4.9% |
| Immigrants | Canada | 98.8 /100 | #65 | Exceptional 4.9% |
| Slovaks | 98.7 /100 | #66 | Exceptional 4.9% |
| New Zealanders | 98.6 /100 | #67 | Exceptional 4.9% |
| Slavs | 98.6 /100 | #68 | Exceptional 4.9% |
| Immigrants | North America | 98.5 /100 | #69 | Exceptional 4.9% |
| Serbians | 98.4 /100 | #70 | Exceptional 4.9% |
| Immigrants | Japan | 98.3 /100 | #71 | Exceptional 4.9% |
| Burmese | 98.3 /100 | #72 | Exceptional 4.9% |
| Paraguayans | 98.3 /100 | #73 | Exceptional 4.9% |
| Immigrants | Northern Europe | 98.2 /100 | #74 | Exceptional 4.9% |
| Turks | 98.0 /100 | #75 | Exceptional 4.9% |
| German Russians | 98.0 /100 | #76 | Exceptional 4.9% |