Chickasaw vs British West Indian Unemployment
COMPARE
Chickasaw
British West Indian
Unemployment
Unemployment Comparison
Chickasaw
British West Indians
5.0%
UNEMPLOYMENT
94.0/ 100
METRIC RATING
103rd/ 347
METRIC RANK
6.8%
UNEMPLOYMENT
0.0/ 100
METRIC RATING
319th/ 347
METRIC RANK
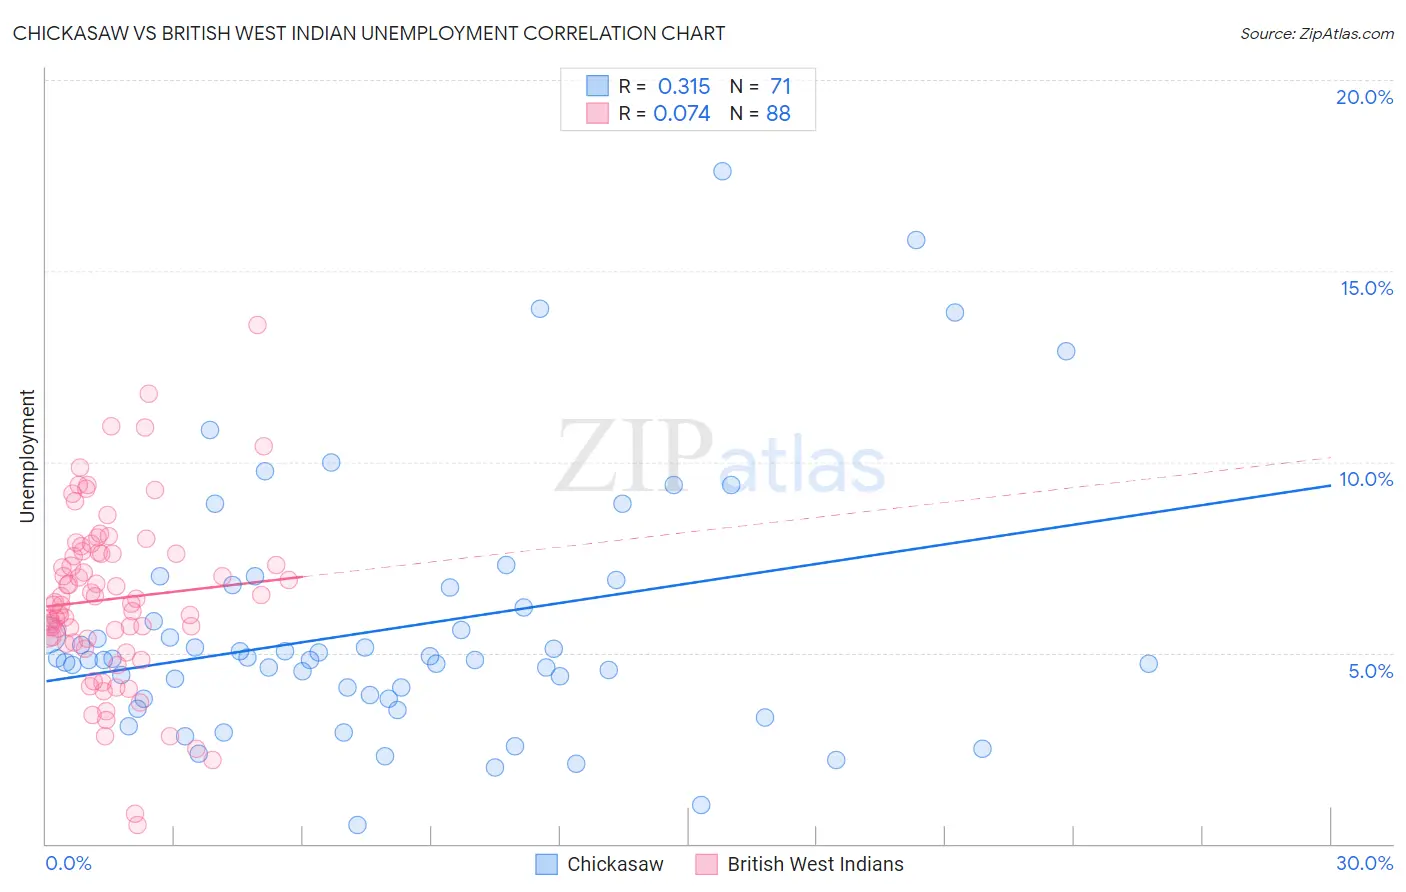
Chickasaw vs British West Indian Unemployment Correlation Chart
The statistical analysis conducted on geographies consisting of 147,562,181 people shows a mild positive correlation between the proportion of Chickasaw and unemployment in the United States with a correlation coefficient (R) of 0.315 and weighted average of 5.0%. Similarly, the statistical analysis conducted on geographies consisting of 152,665,255 people shows a slight positive correlation between the proportion of British West Indians and unemployment in the United States with a correlation coefficient (R) of 0.074 and weighted average of 6.8%, a difference of 35.7%.
Unemployment Correlation Summary
| Measurement | Chickasaw | British West Indian |
| Minimum | 0.50% | 0.50% |
| Maximum | 17.6% | 13.6% |
| Range | 17.1% | 13.1% |
| Mean | 5.6% | 6.4% |
| Median | 4.8% | 6.3% |
| Interquartile 25% (IQ1) | 3.8% | 5.3% |
| Interquartile 75% (IQ3) | 6.7% | 7.6% |
| Interquartile Range (IQR) | 2.9% | 2.3% |
| Standard Deviation (Sample) | 3.3% | 2.3% |
| Standard Deviation (Population) | 3.3% | 2.3% |
Similar Demographics by Unemployment
Demographics Similar to Chickasaw by Unemployment
In terms of unemployment, the demographic groups most similar to Chickasaw are Osage (5.0%, a difference of 0.0%), Maltese (5.0%, a difference of 0.0%), Immigrants from Argentina (5.0%, a difference of 0.040%), Immigrants from Romania (5.0%, a difference of 0.070%), and American (5.0%, a difference of 0.080%).
| Demographics | Rating | Rank | Unemployment |
| Immigrants | England | 95.2 /100 | #96 | Exceptional 5.0% |
| Immigrants | Czechoslovakia | 95.1 /100 | #97 | Exceptional 5.0% |
| Romanians | 95.0 /100 | #98 | Exceptional 5.0% |
| Mongolians | 94.8 /100 | #99 | Exceptional 5.0% |
| Estonians | 94.6 /100 | #100 | Exceptional 5.0% |
| Americans | 94.3 /100 | #101 | Exceptional 5.0% |
| Immigrants | Argentina | 94.1 /100 | #102 | Exceptional 5.0% |
| Chickasaw | 94.0 /100 | #103 | Exceptional 5.0% |
| Osage | 94.0 /100 | #104 | Exceptional 5.0% |
| Maltese | 94.0 /100 | #105 | Exceptional 5.0% |
| Immigrants | Romania | 93.7 /100 | #106 | Exceptional 5.0% |
| Immigrants | Turkey | 93.7 /100 | #107 | Exceptional 5.0% |
| Immigrants | Kuwait | 93.7 /100 | #108 | Exceptional 5.0% |
| Immigrants | Eritrea | 93.3 /100 | #109 | Exceptional 5.0% |
| Immigrants | Lithuania | 93.2 /100 | #110 | Exceptional 5.0% |
Demographics Similar to British West Indians by Unemployment
In terms of unemployment, the demographic groups most similar to British West Indians are Immigrants from Cabo Verde (6.8%, a difference of 0.21%), Immigrants from St. Vincent and the Grenadines (6.9%, a difference of 0.79%), Shoshone (6.8%, a difference of 0.81%), Immigrants from Guyana (6.9%, a difference of 0.81%), and Guyanese (6.9%, a difference of 0.85%).
| Demographics | Rating | Rank | Unemployment |
| Colville | 0.0 /100 | #312 | Tragic 6.6% |
| Immigrants | Barbados | 0.0 /100 | #313 | Tragic 6.6% |
| Blacks/African Americans | 0.0 /100 | #314 | Tragic 6.6% |
| Houma | 0.0 /100 | #315 | Tragic 6.7% |
| Immigrants | Dominica | 0.0 /100 | #316 | Tragic 6.7% |
| Shoshone | 0.0 /100 | #317 | Tragic 6.8% |
| Immigrants | Cabo Verde | 0.0 /100 | #318 | Tragic 6.8% |
| British West Indians | 0.0 /100 | #319 | Tragic 6.8% |
| Immigrants | St. Vincent and the Grenadines | 0.0 /100 | #320 | Tragic 6.9% |
| Immigrants | Guyana | 0.0 /100 | #321 | Tragic 6.9% |
| Guyanese | 0.0 /100 | #322 | Tragic 6.9% |
| Immigrants | Grenada | 0.0 /100 | #323 | Tragic 6.9% |
| Immigrants | Armenia | 0.0 /100 | #324 | Tragic 7.0% |
| Natives/Alaskans | 0.0 /100 | #325 | Tragic 7.0% |
| Paiute | 0.0 /100 | #326 | Tragic 7.1% |