Immigrants from Netherlands vs Immigrants from Eastern Europe Unemployment
COMPARE
Immigrants from Netherlands
Immigrants from Eastern Europe
Unemployment
Unemployment Comparison
Immigrants from Netherlands
Immigrants from Eastern Europe
4.9%
UNEMPLOYMENT
99.0/ 100
METRIC RATING
60th/ 347
METRIC RANK
5.2%
UNEMPLOYMENT
75.3/ 100
METRIC RATING
151st/ 347
METRIC RANK
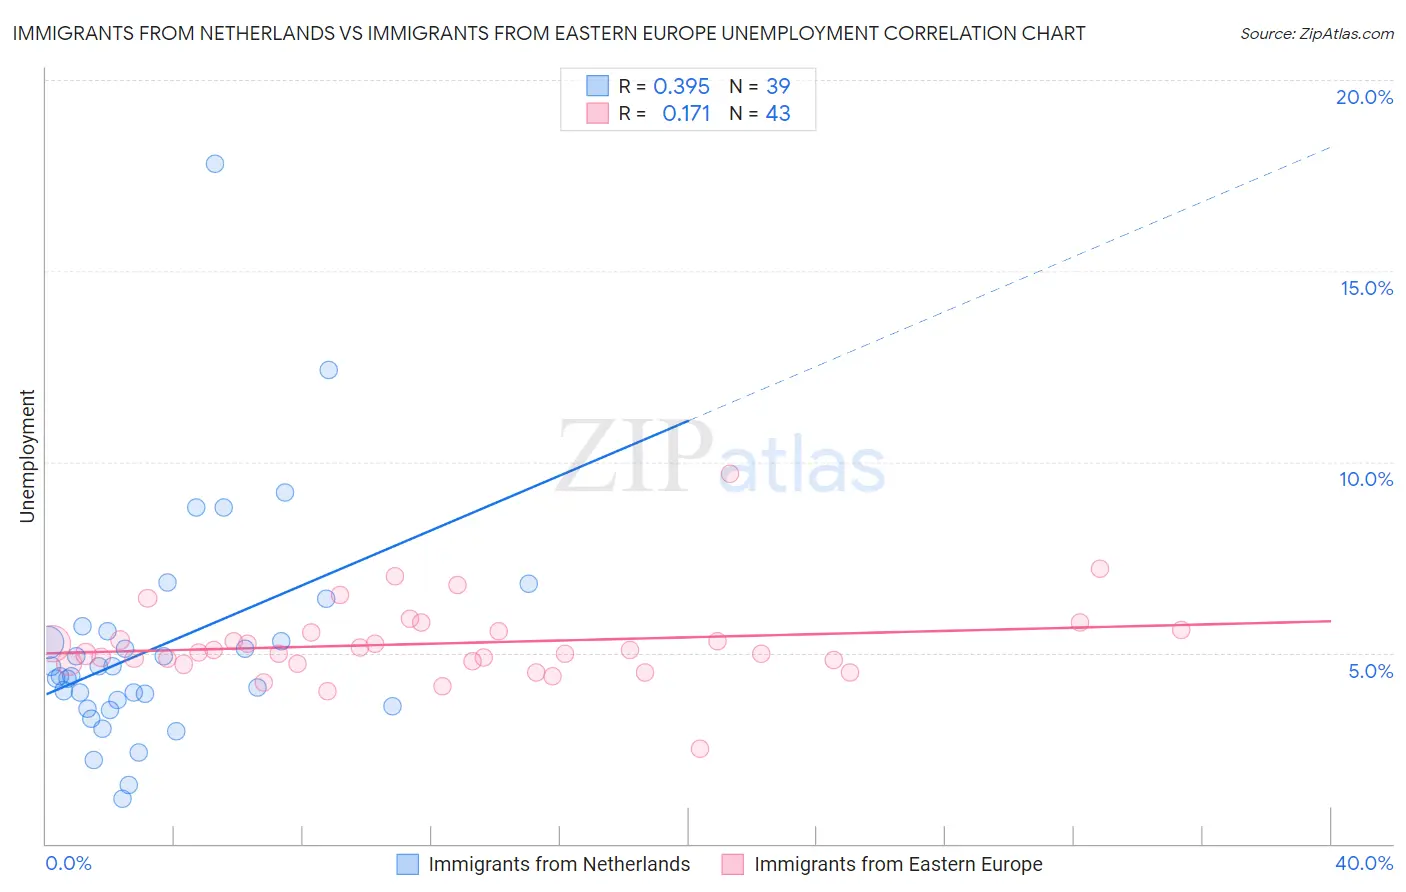
Immigrants from Netherlands vs Immigrants from Eastern Europe Unemployment Correlation Chart
The statistical analysis conducted on geographies consisting of 237,753,486 people shows a mild positive correlation between the proportion of Immigrants from Netherlands and unemployment in the United States with a correlation coefficient (R) of 0.395 and weighted average of 4.9%. Similarly, the statistical analysis conducted on geographies consisting of 474,836,774 people shows a poor positive correlation between the proportion of Immigrants from Eastern Europe and unemployment in the United States with a correlation coefficient (R) of 0.171 and weighted average of 5.2%, a difference of 5.7%.
Unemployment Correlation Summary
| Measurement | Immigrants from Netherlands | Immigrants from Eastern Europe |
| Minimum | 1.2% | 2.5% |
| Maximum | 17.8% | 9.7% |
| Range | 16.6% | 7.2% |
| Mean | 5.2% | 5.2% |
| Median | 4.4% | 5.0% |
| Interquartile 25% (IQ1) | 3.6% | 4.7% |
| Interquartile 75% (IQ3) | 5.6% | 5.6% |
| Interquartile Range (IQR) | 2.0% | 0.84% |
| Standard Deviation (Sample) | 3.0% | 1.1% |
| Standard Deviation (Population) | 3.0% | 1.1% |
Similar Demographics by Unemployment
Demographics Similar to Immigrants from Netherlands by Unemployment
In terms of unemployment, the demographic groups most similar to Immigrants from Netherlands are Cambodian (4.9%, a difference of 0.0%), Icelander (4.9%, a difference of 0.010%), Immigrants from Bulgaria (4.9%, a difference of 0.030%), Bhutanese (4.9%, a difference of 0.050%), and Greek (4.9%, a difference of 0.070%).
| Demographics | Rating | Rank | Unemployment |
| Immigrants | Zimbabwe | 99.2 /100 | #53 | Exceptional 4.9% |
| Eastern Europeans | 99.2 /100 | #54 | Exceptional 4.9% |
| Australians | 99.2 /100 | #55 | Exceptional 4.9% |
| Celtics | 99.1 /100 | #56 | Exceptional 4.9% |
| Immigrants | Singapore | 99.1 /100 | #57 | Exceptional 4.9% |
| Greeks | 99.0 /100 | #58 | Exceptional 4.9% |
| Bhutanese | 99.0 /100 | #59 | Exceptional 4.9% |
| Immigrants | Netherlands | 99.0 /100 | #60 | Exceptional 4.9% |
| Cambodians | 99.0 /100 | #61 | Exceptional 4.9% |
| Icelanders | 98.9 /100 | #62 | Exceptional 4.9% |
| Immigrants | Bulgaria | 98.9 /100 | #63 | Exceptional 4.9% |
| Italians | 98.9 /100 | #64 | Exceptional 4.9% |
| Immigrants | Canada | 98.8 /100 | #65 | Exceptional 4.9% |
| Slovaks | 98.7 /100 | #66 | Exceptional 4.9% |
| New Zealanders | 98.6 /100 | #67 | Exceptional 4.9% |
Demographics Similar to Immigrants from Eastern Europe by Unemployment
In terms of unemployment, the demographic groups most similar to Immigrants from Eastern Europe are Immigrants from Hong Kong (5.2%, a difference of 0.010%), Egyptian (5.2%, a difference of 0.010%), Immigrants from China (5.2%, a difference of 0.050%), Potawatomi (5.2%, a difference of 0.070%), and Syrian (5.2%, a difference of 0.21%).
| Demographics | Rating | Rank | Unemployment |
| Indonesians | 82.3 /100 | #144 | Excellent 5.1% |
| Immigrants | Norway | 81.8 /100 | #145 | Excellent 5.1% |
| Immigrants | Asia | 81.8 /100 | #146 | Excellent 5.1% |
| Indians (Asian) | 81.6 /100 | #147 | Excellent 5.1% |
| Immigrants | Italy | 79.1 /100 | #148 | Good 5.1% |
| Syrians | 77.7 /100 | #149 | Good 5.2% |
| Potawatomi | 76.2 /100 | #150 | Good 5.2% |
| Immigrants | Eastern Europe | 75.3 /100 | #151 | Good 5.2% |
| Immigrants | Hong Kong | 75.2 /100 | #152 | Good 5.2% |
| Egyptians | 75.2 /100 | #153 | Good 5.2% |
| Immigrants | China | 74.7 /100 | #154 | Good 5.2% |
| Immigrants | Northern Africa | 71.3 /100 | #155 | Good 5.2% |
| Immigrants | Kazakhstan | 70.4 /100 | #156 | Good 5.2% |
| Sri Lankans | 69.5 /100 | #157 | Good 5.2% |
| Immigrants | Egypt | 66.7 /100 | #158 | Good 5.2% |