Immigrants from Netherlands vs Native Hawaiian Unemployment
COMPARE
Immigrants from Netherlands
Native Hawaiian
Unemployment
Unemployment Comparison
Immigrants from Netherlands
Native Hawaiians
4.9%
UNEMPLOYMENT
99.0/ 100
METRIC RATING
60th/ 347
METRIC RANK
5.3%
UNEMPLOYMENT
24.1/ 100
METRIC RATING
205th/ 347
METRIC RANK
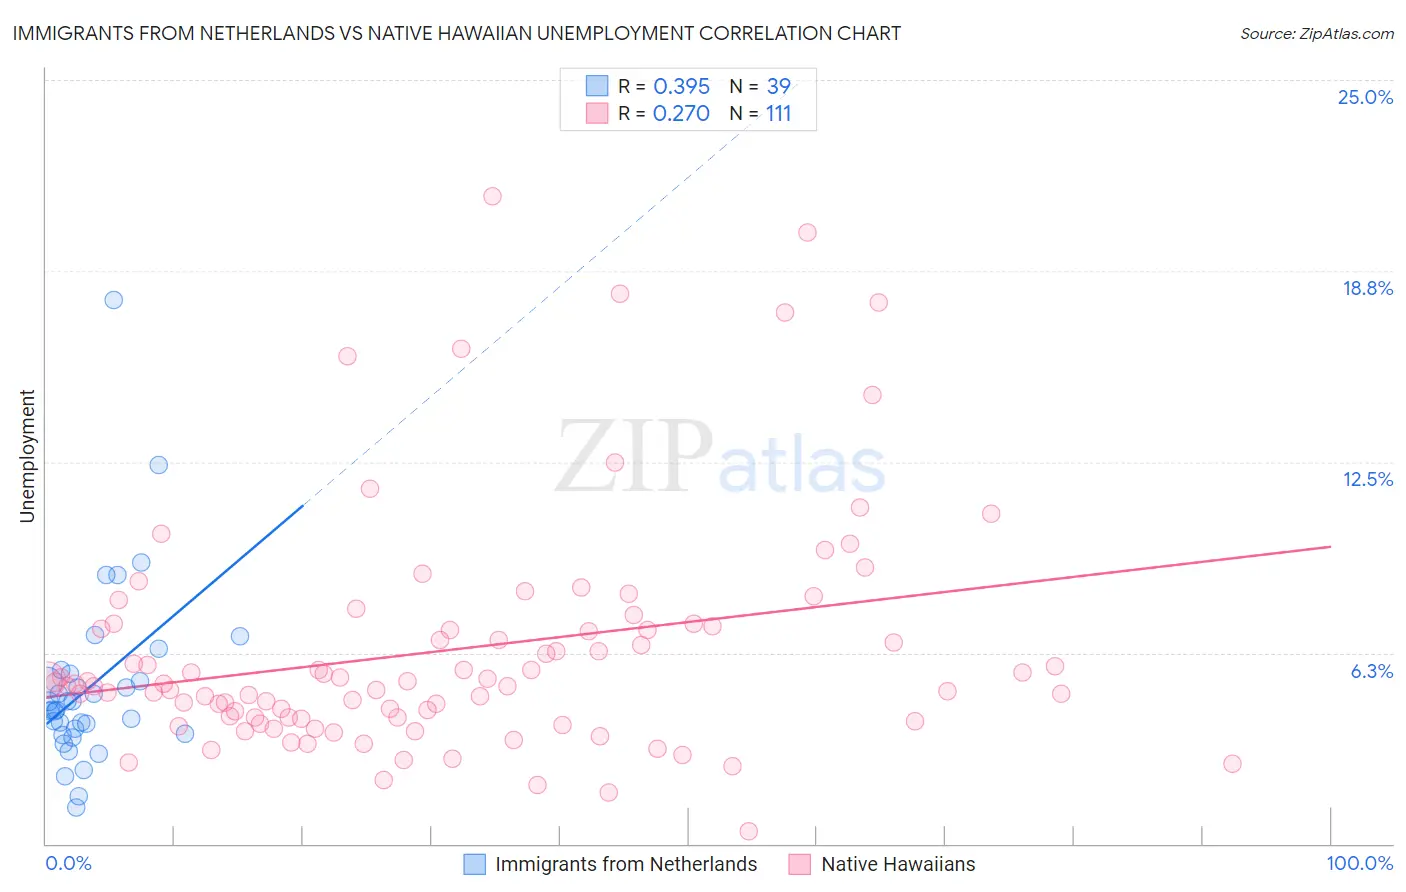
Immigrants from Netherlands vs Native Hawaiian Unemployment Correlation Chart
The statistical analysis conducted on geographies consisting of 237,753,486 people shows a mild positive correlation between the proportion of Immigrants from Netherlands and unemployment in the United States with a correlation coefficient (R) of 0.395 and weighted average of 4.9%. Similarly, the statistical analysis conducted on geographies consisting of 331,714,087 people shows a weak positive correlation between the proportion of Native Hawaiians and unemployment in the United States with a correlation coefficient (R) of 0.270 and weighted average of 5.3%, a difference of 9.4%.
Unemployment Correlation Summary
| Measurement | Immigrants from Netherlands | Native Hawaiian |
| Minimum | 1.2% | 0.40% |
| Maximum | 17.8% | 21.2% |
| Range | 16.6% | 20.8% |
| Mean | 5.2% | 6.3% |
| Median | 4.4% | 5.3% |
| Interquartile 25% (IQ1) | 3.6% | 4.1% |
| Interquartile 75% (IQ3) | 5.6% | 7.1% |
| Interquartile Range (IQR) | 2.0% | 3.0% |
| Standard Deviation (Sample) | 3.0% | 3.9% |
| Standard Deviation (Population) | 3.0% | 3.8% |
Similar Demographics by Unemployment
Demographics Similar to Immigrants from Netherlands by Unemployment
In terms of unemployment, the demographic groups most similar to Immigrants from Netherlands are Cambodian (4.9%, a difference of 0.0%), Icelander (4.9%, a difference of 0.010%), Immigrants from Bulgaria (4.9%, a difference of 0.030%), Bhutanese (4.9%, a difference of 0.050%), and Greek (4.9%, a difference of 0.070%).
| Demographics | Rating | Rank | Unemployment |
| Immigrants | Zimbabwe | 99.2 /100 | #53 | Exceptional 4.9% |
| Eastern Europeans | 99.2 /100 | #54 | Exceptional 4.9% |
| Australians | 99.2 /100 | #55 | Exceptional 4.9% |
| Celtics | 99.1 /100 | #56 | Exceptional 4.9% |
| Immigrants | Singapore | 99.1 /100 | #57 | Exceptional 4.9% |
| Greeks | 99.0 /100 | #58 | Exceptional 4.9% |
| Bhutanese | 99.0 /100 | #59 | Exceptional 4.9% |
| Immigrants | Netherlands | 99.0 /100 | #60 | Exceptional 4.9% |
| Cambodians | 99.0 /100 | #61 | Exceptional 4.9% |
| Icelanders | 98.9 /100 | #62 | Exceptional 4.9% |
| Immigrants | Bulgaria | 98.9 /100 | #63 | Exceptional 4.9% |
| Italians | 98.9 /100 | #64 | Exceptional 4.9% |
| Immigrants | Canada | 98.8 /100 | #65 | Exceptional 4.9% |
| Slovaks | 98.7 /100 | #66 | Exceptional 4.9% |
| New Zealanders | 98.6 /100 | #67 | Exceptional 4.9% |
Demographics Similar to Native Hawaiians by Unemployment
In terms of unemployment, the demographic groups most similar to Native Hawaiians are Immigrants from Ukraine (5.3%, a difference of 0.060%), Immigrants from Micronesia (5.3%, a difference of 0.080%), Cherokee (5.3%, a difference of 0.11%), Immigrants from Peru (5.4%, a difference of 0.13%), and Immigrants from South Eastern Asia (5.3%, a difference of 0.23%).
| Demographics | Rating | Rank | Unemployment |
| Immigrants | Israel | 28.6 /100 | #198 | Fair 5.3% |
| Immigrants | Afghanistan | 28.6 /100 | #199 | Fair 5.3% |
| Koreans | 27.4 /100 | #200 | Fair 5.3% |
| Immigrants | South Eastern Asia | 27.0 /100 | #201 | Fair 5.3% |
| Cherokee | 25.5 /100 | #202 | Fair 5.3% |
| Immigrants | Micronesia | 25.2 /100 | #203 | Fair 5.3% |
| Immigrants | Ukraine | 24.9 /100 | #204 | Fair 5.3% |
| Native Hawaiians | 24.1 /100 | #205 | Fair 5.3% |
| Immigrants | Peru | 22.7 /100 | #206 | Fair 5.4% |
| Creek | 19.4 /100 | #207 | Poor 5.4% |
| Portuguese | 19.0 /100 | #208 | Poor 5.4% |
| Immigrants | Iran | 18.8 /100 | #209 | Poor 5.4% |
| Immigrants | Iraq | 18.6 /100 | #210 | Poor 5.4% |
| Iraqis | 18.1 /100 | #211 | Poor 5.4% |
| Ugandans | 18.0 /100 | #212 | Poor 5.4% |